New Relic
New Relic is one of the most prominent observability platforms. Hundreds of companies trust New Relic to gather and analyze data and respond to incidents in real-time. DagsHub lets you connect to New Relic to monitor and analyze machine learning training metrics. You can log experiments using MLflow, create custom metrics, and set alerts for them.
Prerequisites
To log experiments to New Relic in real-time, you must first log metrics in real-time to DagsHub. This is done using MLflow. To learn how to log metrics to DagsHub using MLflow, please read the MLflow docs on DagsHub.
How does the integration of DagsHub with New Relic work?
DagsHub forwards training metrics, logged by MLflow, to your New Relic account using API calls. This lets you analyze your data using NRQL, and turn on customized alerts. To learn how to integrate DagsHub with New Relic and monitor machine learning training metrics in real-time, please read the DagsHub and New Relic integration documentation.
How to use New Relic with DagsHub?
Send metrics to New Relic in real-time
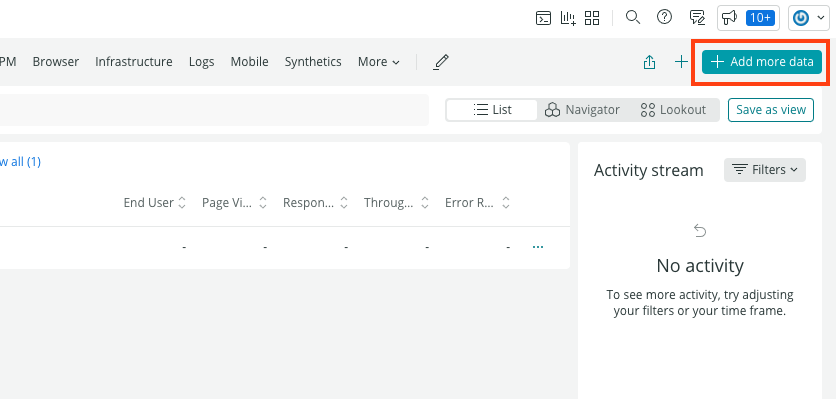
- From your New Relic home screen hit "Add more data" in the top right corner of the screen.
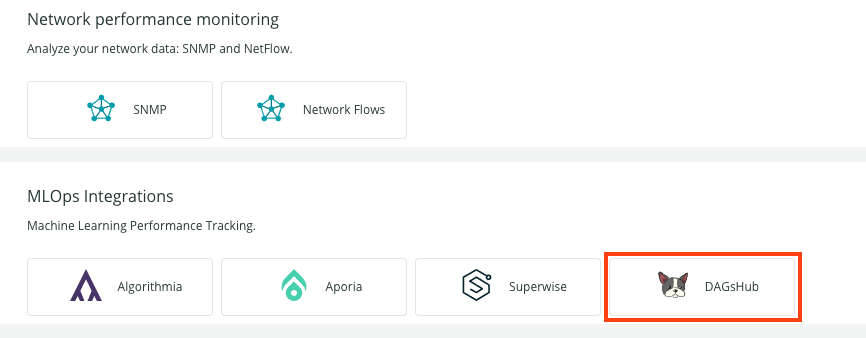
Add integration on New Relic - Then select the DagsHub Integration.
Add DagsHub integration on New Relic - Take note of your account id and copy your API key.
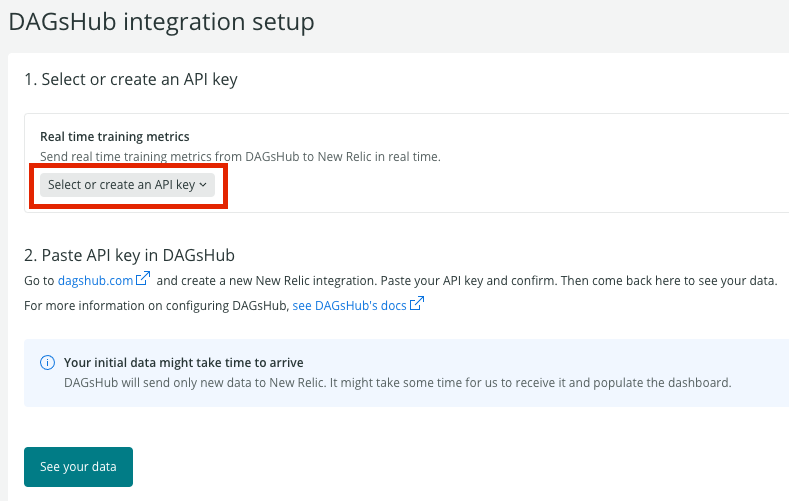
Copy the New Relic API key - From your DagsHub repository, go to the setting menu and click on the integrations tab.
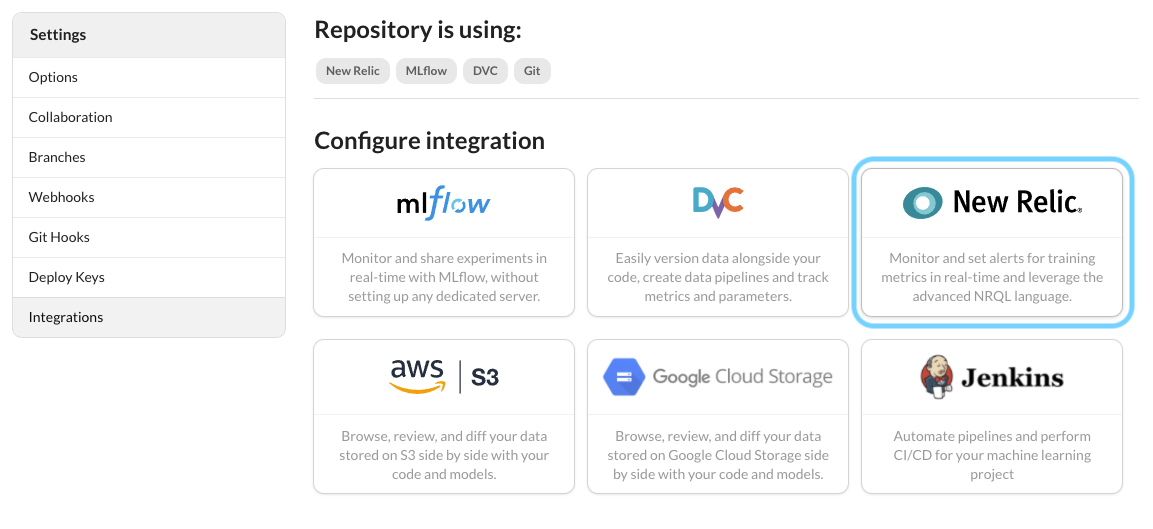
Integration page Note: You can find the integrations page using the following URL: https://dagshub.com/{username}/{reponame}/settings/integrations - Follow the wizard, where you will be asked to enter your Account Id and API key
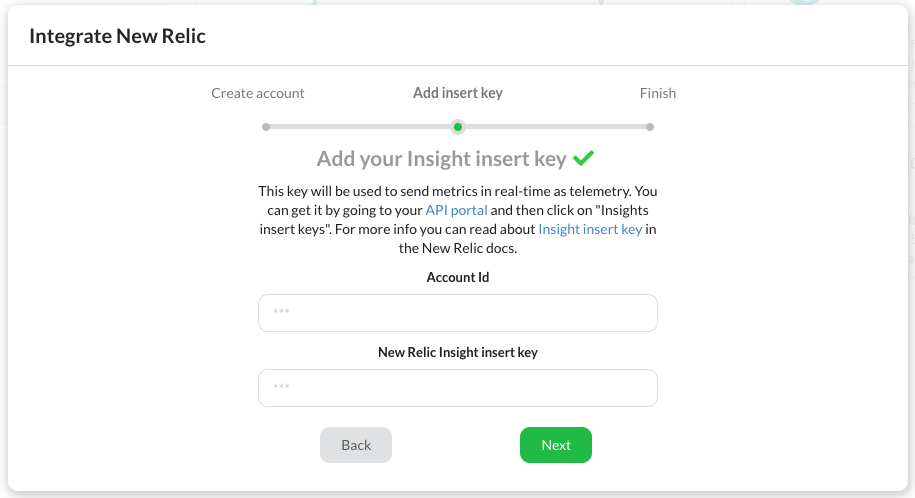
New Relic Wizard
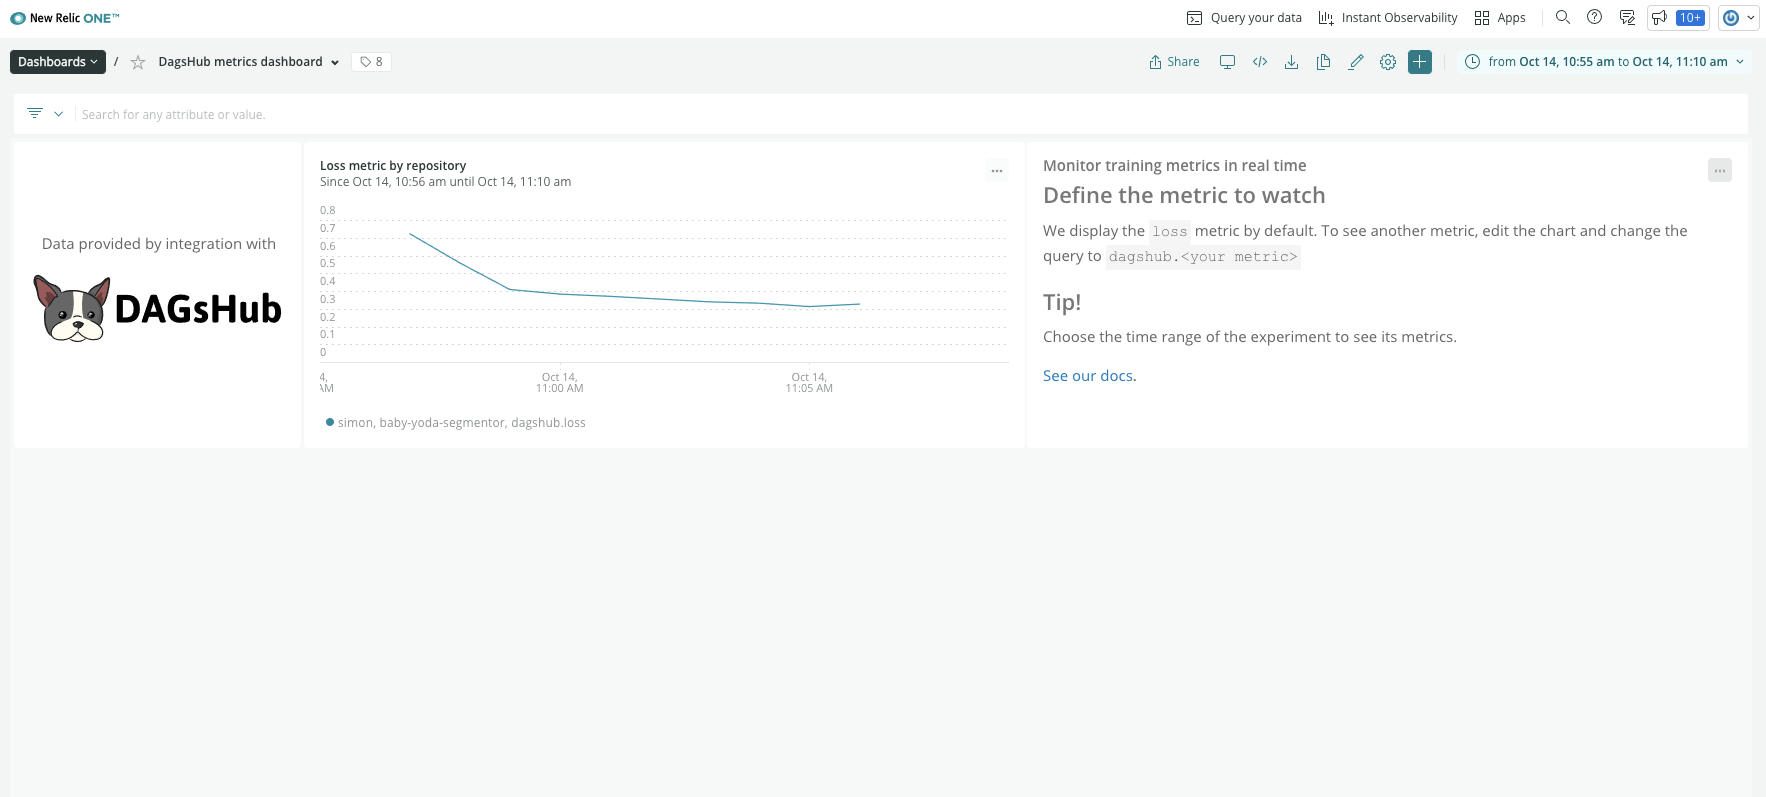
Visualize metrics in a dashboard
By connecting DagsHub to New Relic, you get a fully configured dashboard that shows your training and evaluation metrics in real-time.
Create a custom dashboard
- From the New Relic home page, click on Dashboards in the main menu. In the top right corner of the page, click "Create a dashboard". Insert a name for your dashboard and hit "Create".
- To add a metric, click on one of the boxes in your dashboard, where the label "Add a new chart" appears.

Add chart button - Then select "Add a chart".
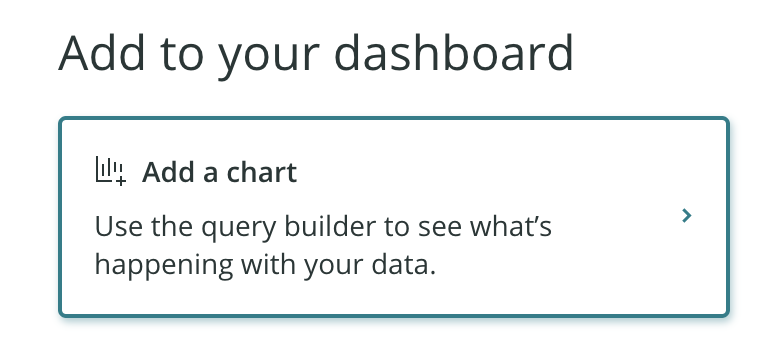
Add chart -
Now it's time to write NRQL. The following is the query language used by New Relic to fetch information from all its sources. Use this example query as a reference to display a metric, replace
metric_namewith the name you gave to your metric in your pipeline.SELECT latest(<metric_name>) FROM Metric TIMESERIES SINCE 1800 seconds ago -
Click "Run" to preview the result, or Save to add the chart to your dashboard.
Monitor in real-time and analyze custom metrics
Some metrics are lineary dependent, but they give a better grasp of the data than looking at a set of raw orthogonal metrics. You might want to look at squared values or absolute values for instance. Logging those metrics seems like data duplication, and often you will manipulate your metrics postmortem. The query language used to fetch your metrics is called NRQL, and it can be leveraged to calculate custom metrics out of your raw metrics. You can log orthogonal metrics, and monitor any metric created out of them in real-time, as long as it's computable using NRQL.
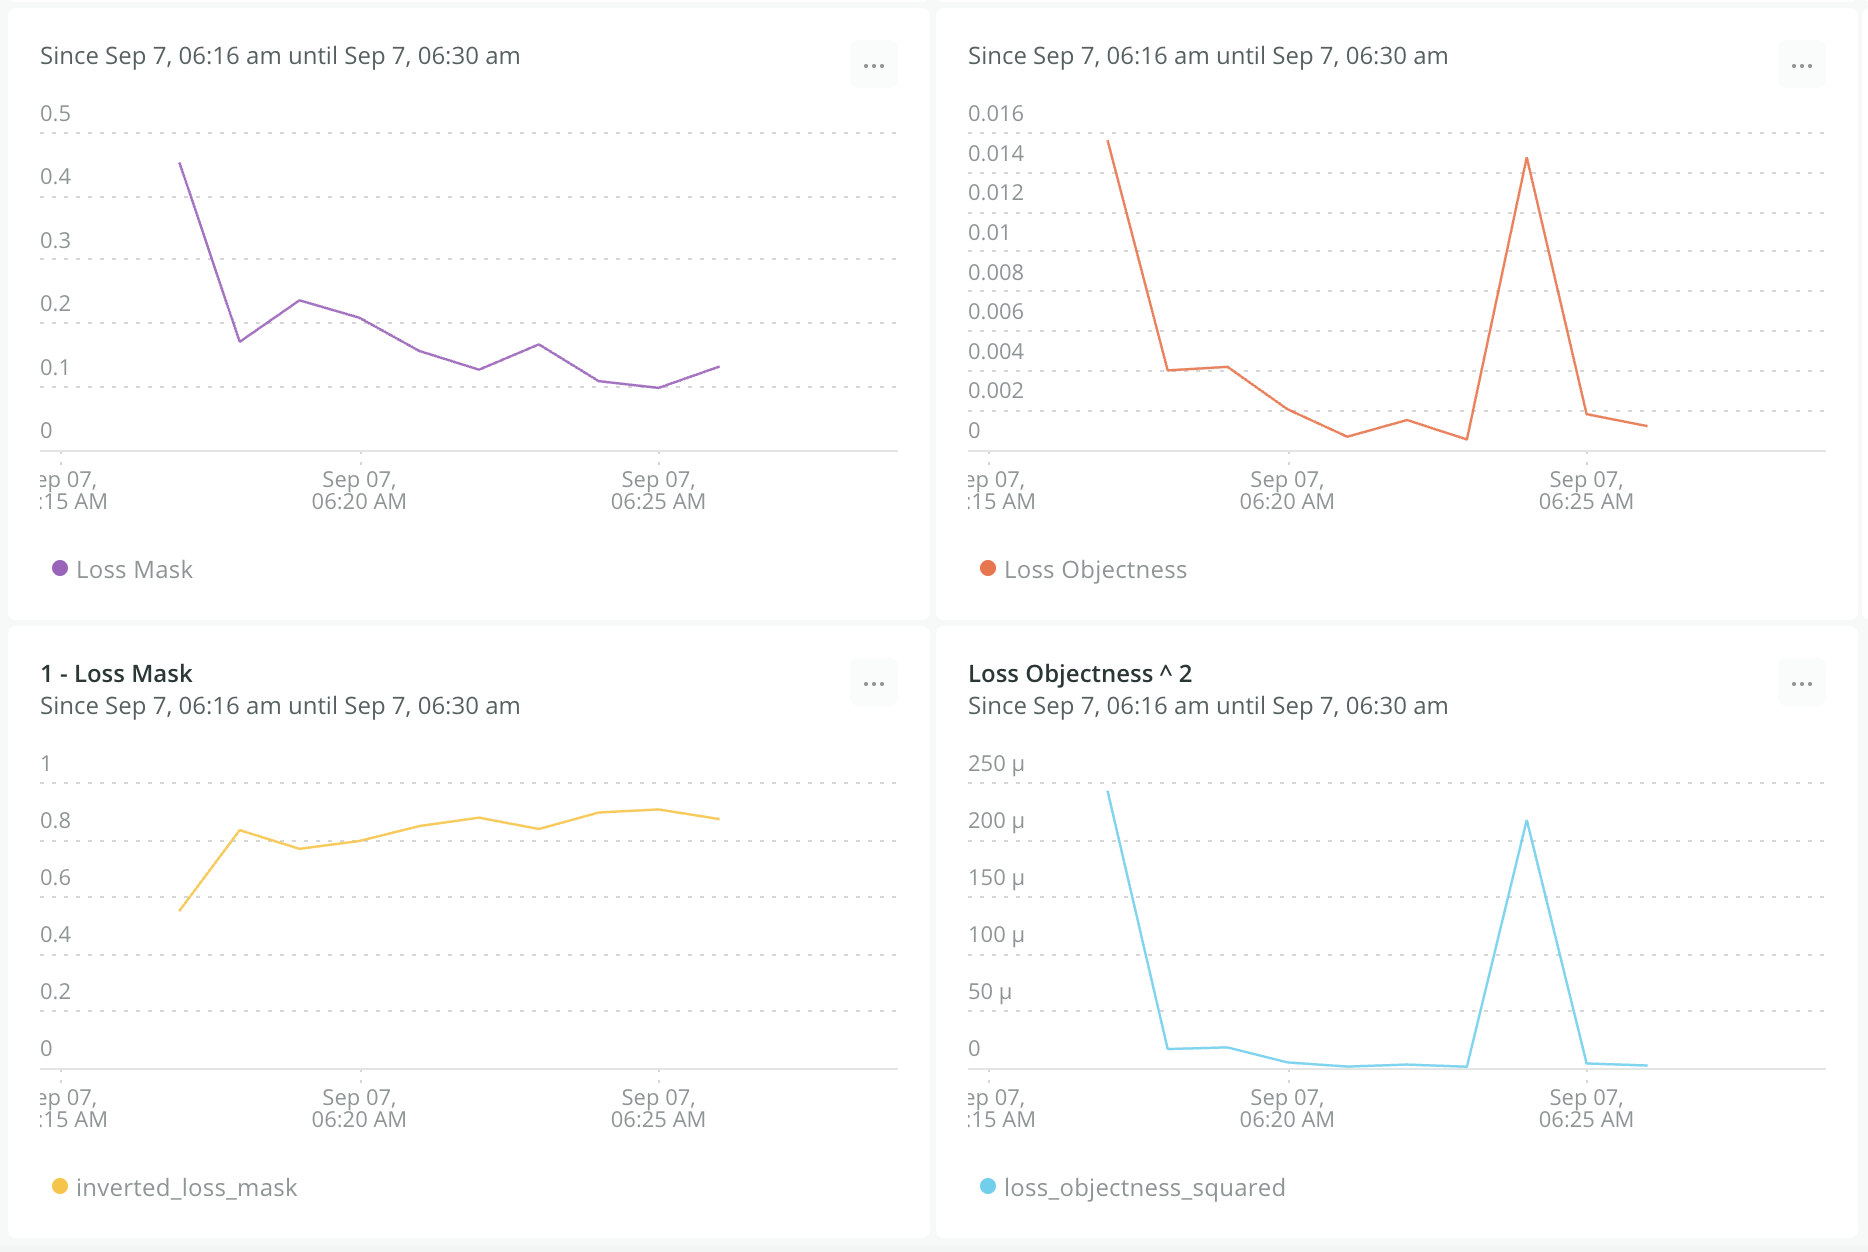
The process to monitor a custom metric is the same as monitoring a metric, besides the query itself. Let's monitor the squared value of our metric named "Loss Objectness".
- Duplicate the "Loss Objectness" chart by clicking on the ellipsis, and duplicate.
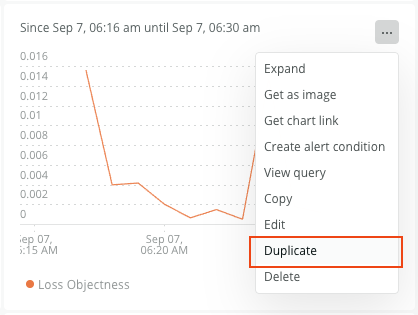
Duplicate chart -
On your duplicated chart, click on the ellipsis again, then edit. The query editor will pop. Instead of the original query, let's multiply the value by itself:
SELECT latest(loss_objectness)*latest(loss_objectness) as loss_objectness_squared FROM Metric TIMESERIES SINCE 1800 seconds ago -
Give an informative name to your chart and hit "Save". This is it, from now on you can see the squared value of "Loss Objectness" while the metric is being logged during your training sessions. To see the full extent of NRQL capabilities, please refer to NRQL syntax, clauses, and functions.
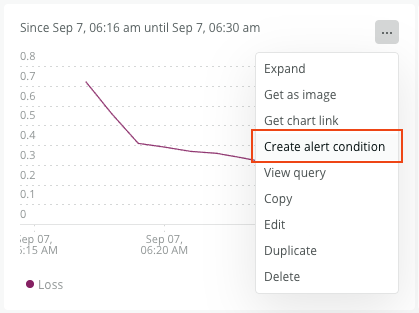
Set an alert
You can use alerts to receive notifications that a metric reached a specific value or fills a certain condition. The simplest way to set an alert is from an existing metric on your dashboard. 1. Click on the ellipsis in the top right corner of the chart, and select "Create alert condition".