

Experiments Tracking
DagsHub users can easily log their experiments to their DagsHub project using MLflow Tracking and visualize them interactively. View your experiments in a table, or compare them in various ways, such as coordinate plots, chart plots, and a simple side-by-side presentation of the logs.
Why is logging important?
In the world of data science, conducting experiments is a fundamental component of the project, as we heavily rely on research and empirical analysis. As scientists, we need to keep meticulous logs of our experiments in order to be able to draw conclusions. Without these records, we're merely blindly guessing.
With logs of each experiment, we have the ability to compare experiments to one another to determine if our hyptheses are true or false. This is how we can improve our models.
Setting up MLflow
1. Install and import MLflow
-
Start by installing the MLflow python package in your virtual environment using pip:
pip3 install mlflow -
Then, you will import MLflow to our python module using
import mlflowand log the information with MLflow logging functions. .
2. Set DagsHub as the remote URI
Recommended Approach
The easiest way to set up MLflow with DagsHub is using dagshub.init() from the DagsHub Python client.
This function automatically configures the MLflow tracking URI and handles authentication for you.
📖 See the Track ML Experiments guide for complete setup instructions and examples.
Manual configuration:
You can set the MLflow server URI by adding the following line to our code:
mlflow.set_tracking_uri(https://dagshub.com/<DagsHub-user-name>/<repository-name>.mlflow)
Set the MLflow server URI using an environment variable
You can also define your MLflow server URI using the MLFLOW_TRACKING_URI environment variable.
We don't recommend this approach, since you might forget to reset the environment variable when switching between different projects. This might result in logging experiments to the wrong repository.
If you still prefer using the environment variable, we recommend setting it only for the current command, like the following:
MLFLOW_TRACKING_URI=https://dagshub.com/<username>/<repo>.mlflow python3 <file-name>.py
3. Set-up your credentials
The DagsHub MLflow server has built-in access controls. Only a repository contributor can log experiments
(someone who can git push to the repository).
In order to use basic authentication with MLflow, you need to set the following environment variables:
MLFLOW_TRACKING_USERNAME- DagsHub usernameMLFLOW_TRACKING_PASSWORD- DagsHub password or preferably an access token
For terminal/shell environments:
export MLFLOW_TRACKING_USERNAME=<username>
export MLFLOW_TRACKING_PASSWORD=<password/token>
For Python scripts and notebook environments (Jupyter, Google Colab):
Use Python's os.environ to set environment variables directly in your code:
import os

os.environ['MLFLOW_TRACKING_USERNAME'] = '<username>'
os.environ['MLFLOW_TRACKING_PASSWORD'] = '<password/token>'
Important for Notebook Users
Do NOT use shell commands in notebook environments:
# ❌ This does NOT work in Jupyter/Colab notebooks:
!export MLFLOW_TRACKING_USERNAME=<username>
!export MLFLOW_TRACKING_PASSWORD=<password>
Why? Shell commands (prefixed with !) run in a separate subprocess. Environment variables set this way are not accessible to your Python kernel.
✅ Always use os.environ in Python/notebook code:
import os
os.environ['MLFLOW_TRACKING_USERNAME'] = '<username>'
os.environ['MLFLOW_TRACKING_PASSWORD'] = '<password/token>'
For Google Colab with secure token storage:
Store your token in Colab Secrets and retrieve it securely:
import os
from google.colab import userdata

os.environ['MLFLOW_TRACKING_USERNAME'] = '<username>'
os.environ['MLFLOW_TRACKING_PASSWORD'] = userdata.get('DAGSHUB_TOKEN')
You can also use your token as username; in this case the password is not needed:
export MLFLOW_TRACKING_USERNAME=<token>
Get or create an experiment
You can log runs without logging experiments - in which case all runs will appear under a default experiment. However, you can create custom experiments to better organize your workflow. To get or create an experiment with a particular name, you can use the following function:
import mlflow

def get_or_create_experiment_id(name):
    exp = mlflow.get_experiment_by_name(name)
    if exp is None:
        exp_id = mlflow.create_experiment(name)
        return exp_id
    return exp.experiment_id
Once you have an experiment ID, you can start an MLflow run using:
with mlflow.start_run(experiment_id=<experiment id>):
    # Log metrics, parameters, artifacts to MLflow
Auto-logging Experiments
Automatic logging allows you to log metrics, parameters, and models without the need for explicit log statements. In most cases, you can use:
mlflow.<framework>.autolog()

with mlflow.start_run():
    # Log metrics, parameters, artifacts to MLflow
Supported Auto-logging frameworks
MLflow supports many popular frameworks for autologging. Each framework also has a specific autolog() method that can be used in place of the generic one above.
| Framework | Auto-Logging Snippet |
|---|---|
| PyTorch Lightning | mlflow.pytorch.autolog() |
| Tensorflow / Keras | mlflow.tensorflow.autolog() |
| Hugging Face Transformers | mlflow.transformers.autolog() |
| Scikit-Learn | mlflow.sklearn.autolog() |
| XGBoost | mlflow.xgboost.autolog() |
| Fast.ai | mlflow.fastai.autolog() |
| Spark | mlflow.spark.autolog() |
| PySpark | mlflow.pyspark.ml.autolog() |
| Gluon | mlflow.gluon.autolog() |
| LightGBM | mlflow.lightgbm.autolog() |
| Statsmodels | mlflow.statsmodels.autolog() |
| Paddle | mlflow.paddle.autolog() |
Manually logging parameters and metrics
You can log metrics and parameters either one at a time or many at once. The general structure looks like:
-
Parameters
- Single:
mlflow.log_param(key, value) - Multiple:
mlflow.log_params(dict)
- Single:
-
Metrics
- Single:
mlflow.log_metric(key, value) - Multiple:
mlflow.log_metrics(dict)
- Single:
A concrete example might look like:
with mlflow.start_run(experiment_id=exp_id):
    # Single parameter
    mlflow.log_param("img_size", IMG_SIZE)

    # Multiple parameters
    mlflow.log_params({
        "img_size": IMG_SIZE,
        "learning_rate": LR,
        "epochs": EPOCHS
    })

    # Single metric
    mlflow.log_metric("test_set_loss", test_loss)

    # Multiple metrics
    mlflow.log_metrics({
        "test_set_loss": test_loss,
        "test_set_accuracy": test_accuracy,
    })
Logging artifacts
Artifacts can be logged using the log_artifact method and passing in the path to the model file or directory:
with mlflow.start_run(experiment_id=exp_id):
    mlflow.log_artifact(MODELS_DIR)
Logging DagsHub datasets
You can log Data Engine datasources and datasets to MLflow, by using the log_artifact function.
This will log a pointer file to MLflow, which you can use to trace back your experiment to the data source you used.
Let's say we have a dataset we got using the following code:
from dagshub.data_engine import datasets
ds = datasets.get_dataset('<repo_owner>/<repo_name>', '<dataset_name>')
Now to log your dataset to MLflow, simply run:
with mlflow.start_run(experiment_id=exp_id):
    mlflow.log_artifact(ds.save_to_file(path="<path/to/save/into>", name="<pointer_file_name>"))
path and name are optional and default to the current directory, and the datasource name, respectively.
This will save your dataset information to a pointer file, and return the path, which MLflow will use to upload it to the experiment artifacts.
Note
The pointer file does not include the dataset contents, only a pointer file. This makes this step light and easy, but lets you reproduce results whenever you need to.
Logging System Metrics
MLflow client versions greater than 2.9.2 provide out of the box system metrics logging (run pip install -U mlflow to upgrade to the latest version).
To enable system metrics you need to install the following packages:
pip install psutil
# Install this for GPU metric logging
pip install pynvml
You can enable system metrics in 3 ways:
- Environment variable:
Run the following command in your terminal:
Or in a notebook environment:
export MLFLOW_ENABLE_SYSTEM_METRICS_LOGGING=trueimport os os.environ["MLFLOW_ENABLE_SYSTEM_METRICS_LOGGING"] = "true" - Python client:
Run the following command in your Python code:
mlflow.enable_system_metrics_logging() - Using
mlflow.start_run(log_system_metrics=True)
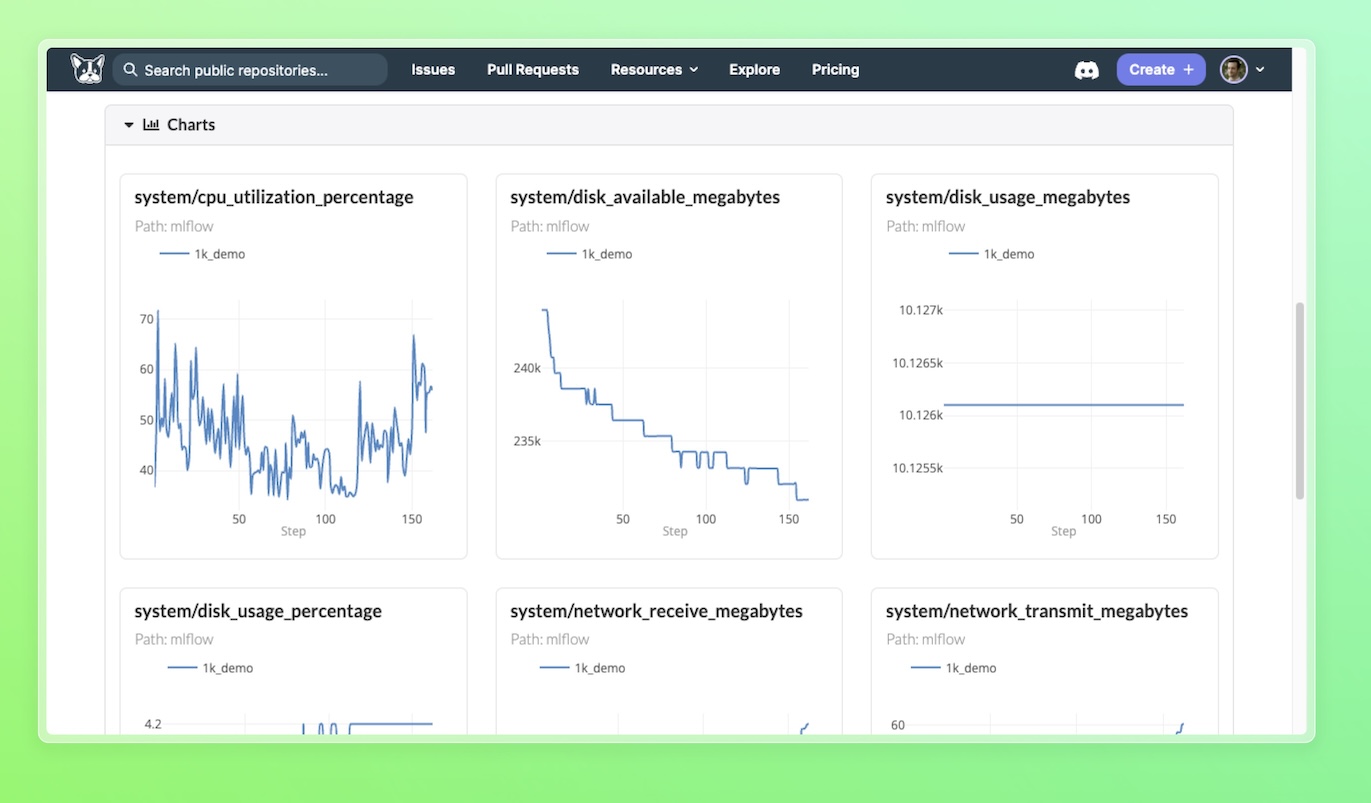
Then, you'll be able to see system metrics in your experiment, alongside run metrics:
Experiment Table Usage
The experiments tab is where you can find all your project's experiments. Each row in the table represents one experiment that was either created by MLflow. A column can be a parameter, metric, or meta-data for that experiment.
What information does the experiment table hold?
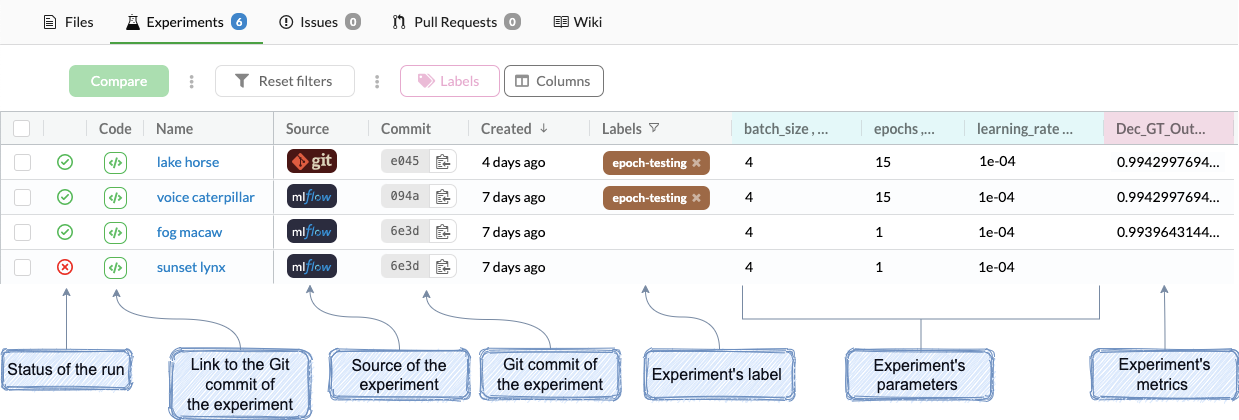
Experiment Table
Experiment Table Columns
- Status of the run:
- Successful.
- Failed.
- Still Running.
- Code - Link to the Git commit:
- Git experiment - the Git commit that produced this experiment.
- MLflow experiment - the last Git commit before executing the experiment.
- Name - The name of the experiment will be generated randomly. It can be changed manually in the singel experiment view.
- Source - the tool that was used to produce the experiment - MLflow.
- Commit:
- Git experiment - the Git commit that produced this experiment.
- MLflow experiment - the last Git commit before executing the experiment.
- Created - How long ago the experiment was created.
- Lable - The label of the experiment.
- Blue background - the experiment's parameters.
- Pink background - the experiment's metrics.
What are the experiments tab capabilities?
Label experiments
-
What: To help you manage many different experiments, DagsHub enables you to label them as you wish. For example, you can label them based on the hypothesis that they belong to (e.g., epoch testing, model testing, parameter testing, etc.) or by their relevance. Also, there is a special label that allows you to hide experiments named "hidden". You can use labels to group experiments together, and then filter them to show only specific groups.
-
How: Hover over the label column in the row of the experiment and click on the plus sign. A drop-down menu will open with labels you can choose from or create a new one by typing it and clicking on "create label".
Label Experiments
Filter experiments
-
What: To show only the relevant experiments, you can filter each column by different parameters.
-
How: Hover over the column header and click on the
 sign. It will enable you to choose the filter method
(e.g., created column - by date, label - labels to include and exclude, etc.).
sign. It will enable you to choose the filter method
(e.g., created column - by date, label - labels to include and exclude, etc.).
Info
You can restart all filters by clicking on the “Reset filters” button.
Filter Experiments
Hide experiments
-
What: Some experiments are not relevant anymore or didn't provide valuable insights. To keep them in the DB but not to show them in the table, you can hide them.
-
How: Hover over the label column in the row of the experiment, click on the plus sign, and choose the "hidden" label. To filter the experiments labeled as hidden, make sure that you exclude them in the filtering option of the label column (default option).
Hide Experiments
Add / Hide columns
-
What: Presenting all the information all the time can be confusing. DagsHub enables you to choose which columns to show or hide in the table.
-
How: Click the Columns button, which will open the column selection menu. There you can click a column name to select or de-select it or drag and drop to change the order of columns.
Add / Hide Columns
Sort experiments
-
What: DagsHub enables you to sort experiments based on single column values.
-
How: Click the arrows on the relative column header. You can sort in ascending or descending order.
Sort Experiments
Present a single experiment
- What: The single experiment view helps you understand an experiment at a deeper level. It includes a more detailed view of the experiment parameters and metrics, as well as interactive graphs of metrics over time.
- How: Click on the name of the experiment.
Single Experiment
Delete experiments
- What: Delete experiments tracked by mlflow. This action is irreversible.
- How: Check the experiments you want to delete, than hit the "Delete" button. Alternatively, when viewing a single experiment, hit the trash can icon at the top of the page.
How to compare experiments?
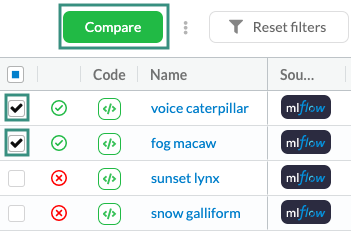
Check the checkbox of 2 or more experiments in the experiment table. After checking the experiments, you'd like to compare, click the "compare" button to go to the view.
Info
Clicking the blue box in the table header will automatically check or uncheck all experiments.
The experiment comparison view looks similar to the single experiment view but is geared towards showing differences in performance between the compared runs.
Comparison table
The comparison table shows the different metadata, parameters, and latest metric values in a table view. This can help show how different parameter choices affected performance, and is probably more suitable when you compare a relatively small amount of experiments.
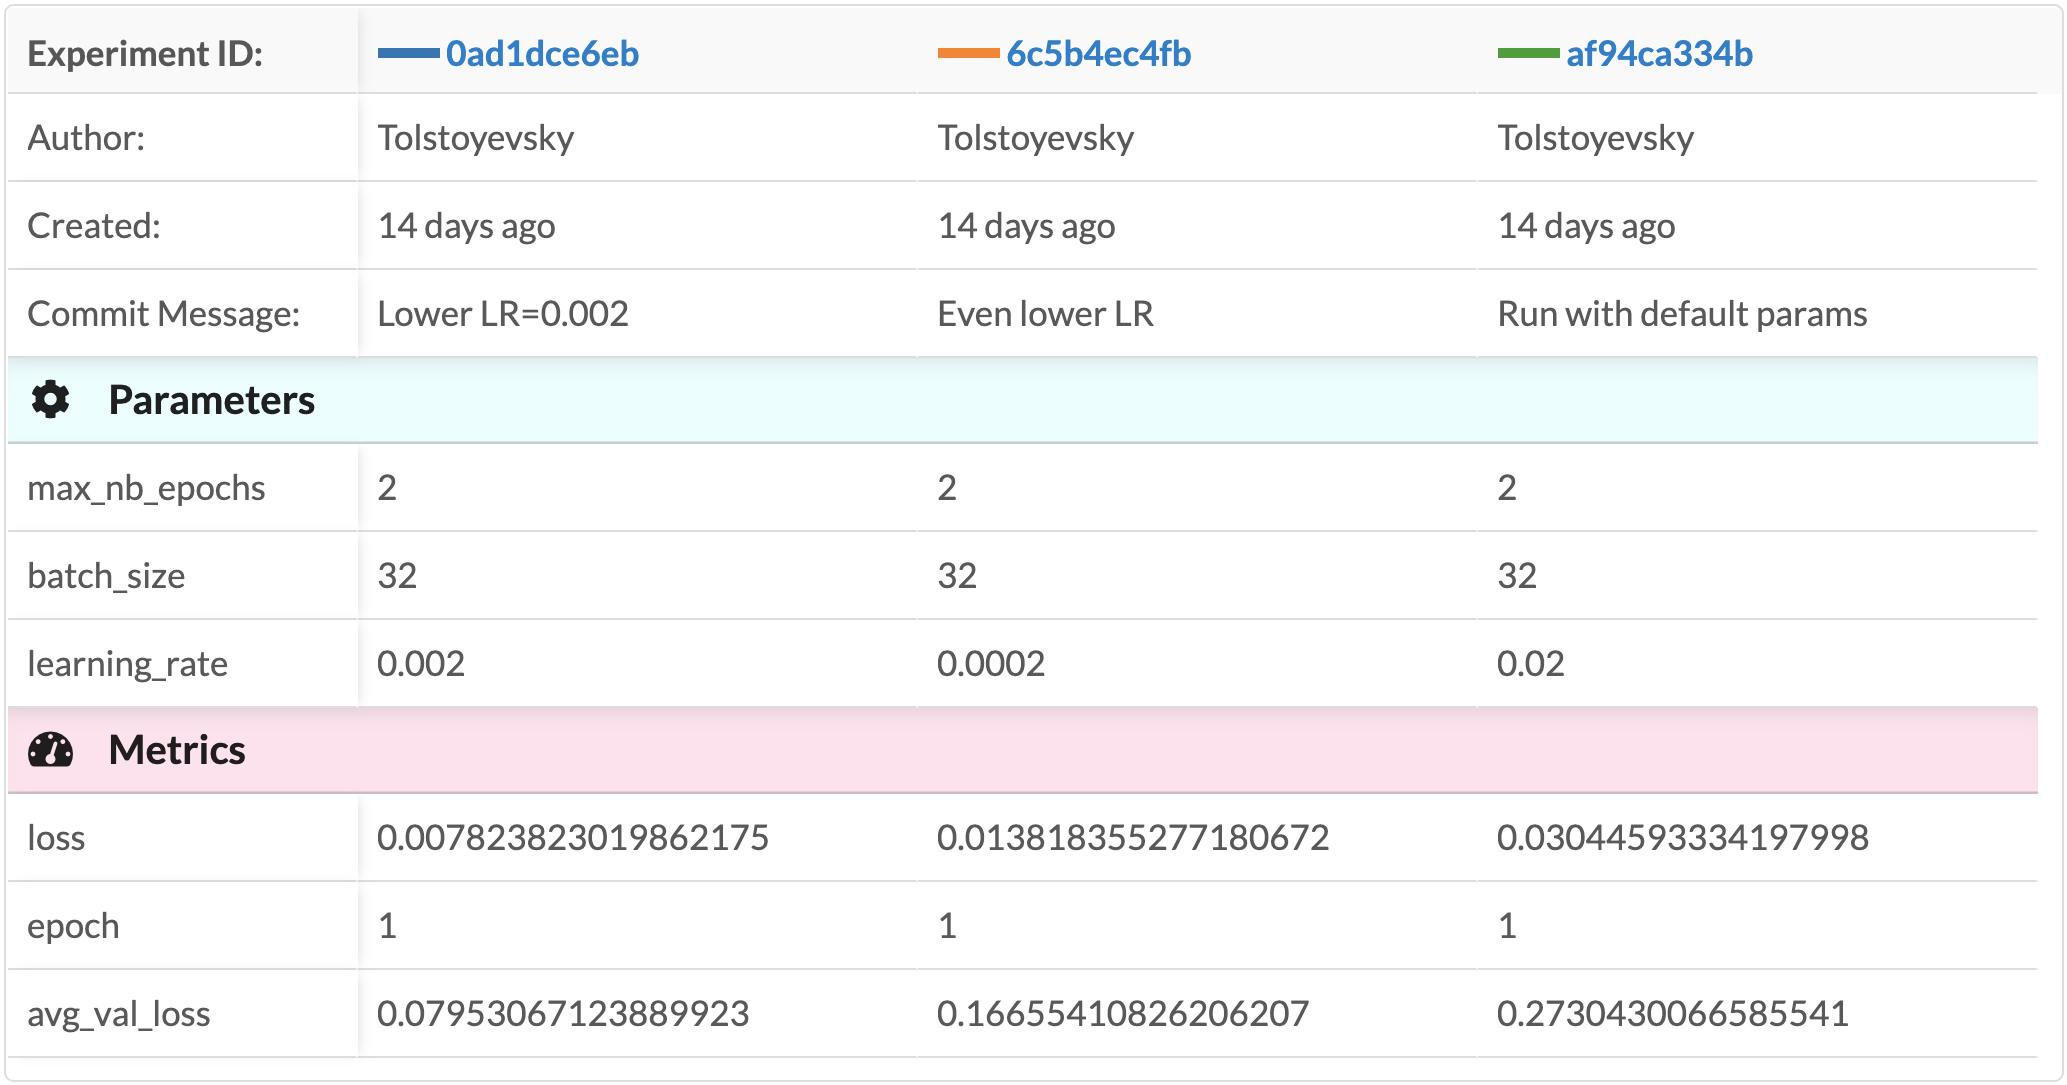
Comparison Table
Info
The colors next to each commit ID represent the color that will correspond to its lines in the metric chart view.
Parallel coordinates plot
To dive deeper into the relationships between parameter choices and metrics and look at a very broad set of experiments, you can use the parallel coordinates plot.
Info
Only parameters and metrics that appear in all compared experiments will be available in the parallel coordinate plot view.
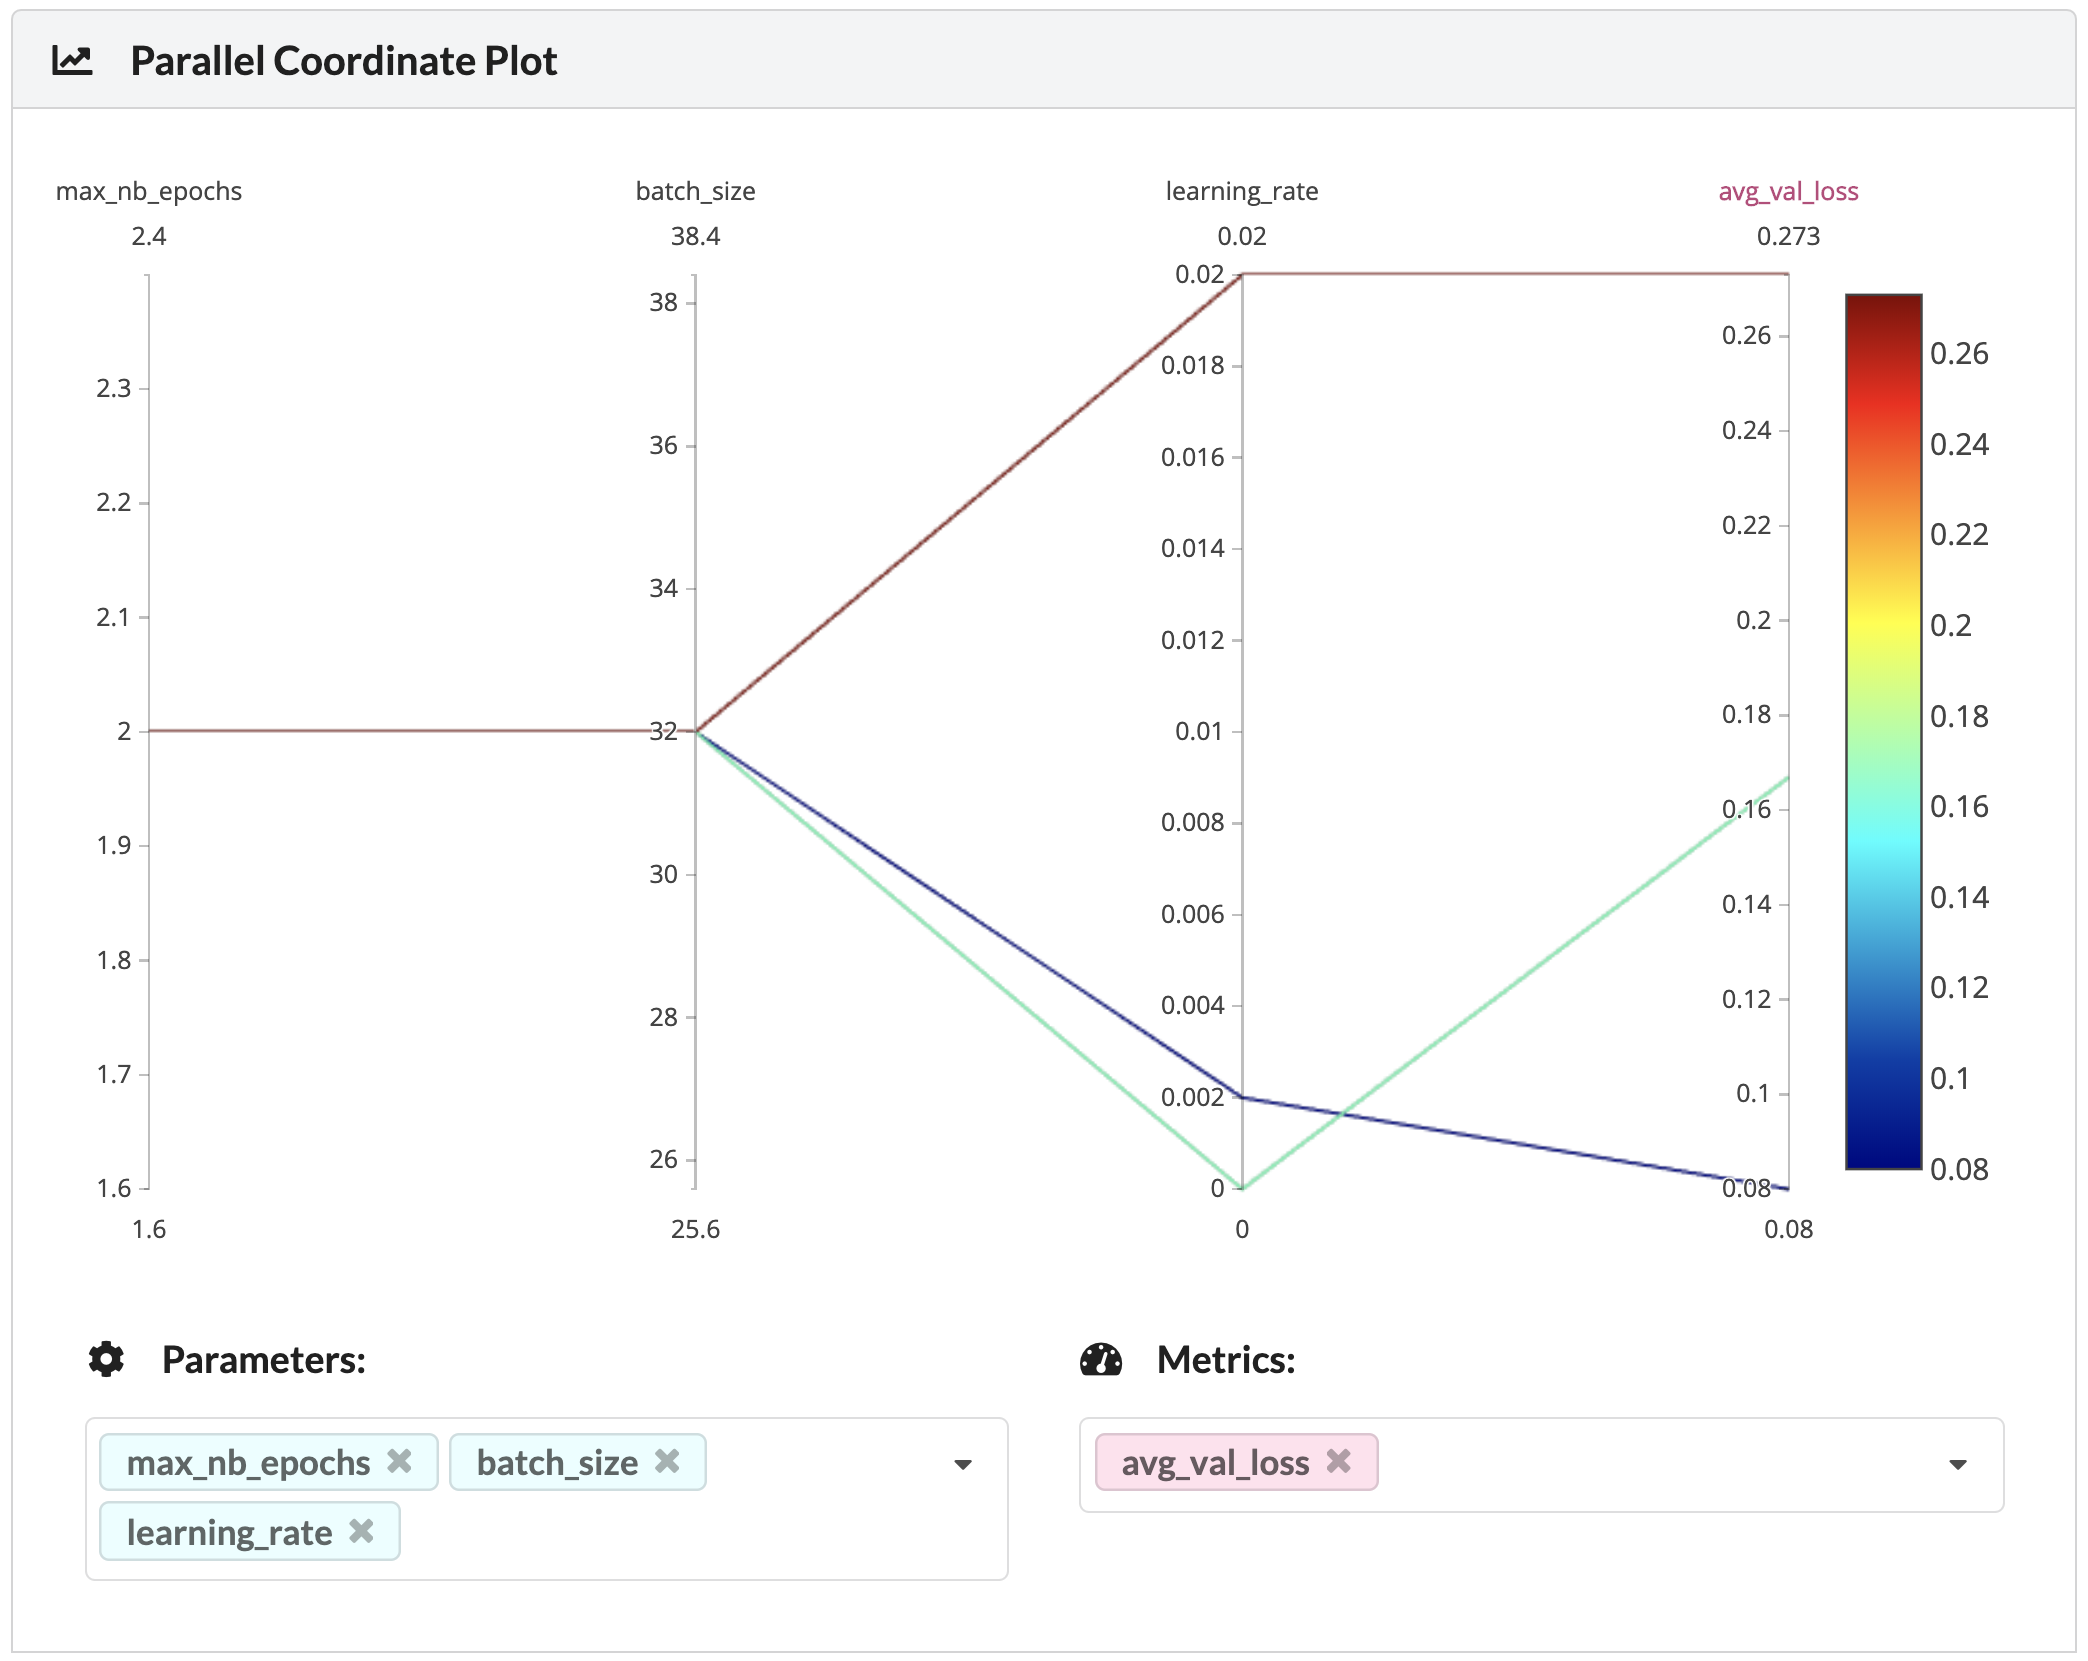 Parallel Coordinates Plot
In the example seen in the image above, you can see that the parameter determining the avg_val_loss metric is the
learning rate parameter. Perhaps un-intuitively, you can see that the lowest and highest learning rates produce higher
losses than the middle learning rate. This is a simple example of the insights that might be gained from this plot.
Metric charts view
The last section of the comparison view is a list of charts that include all metrics that exist for the compared experiments. Each chart includes lines for the relevant compared experiments.
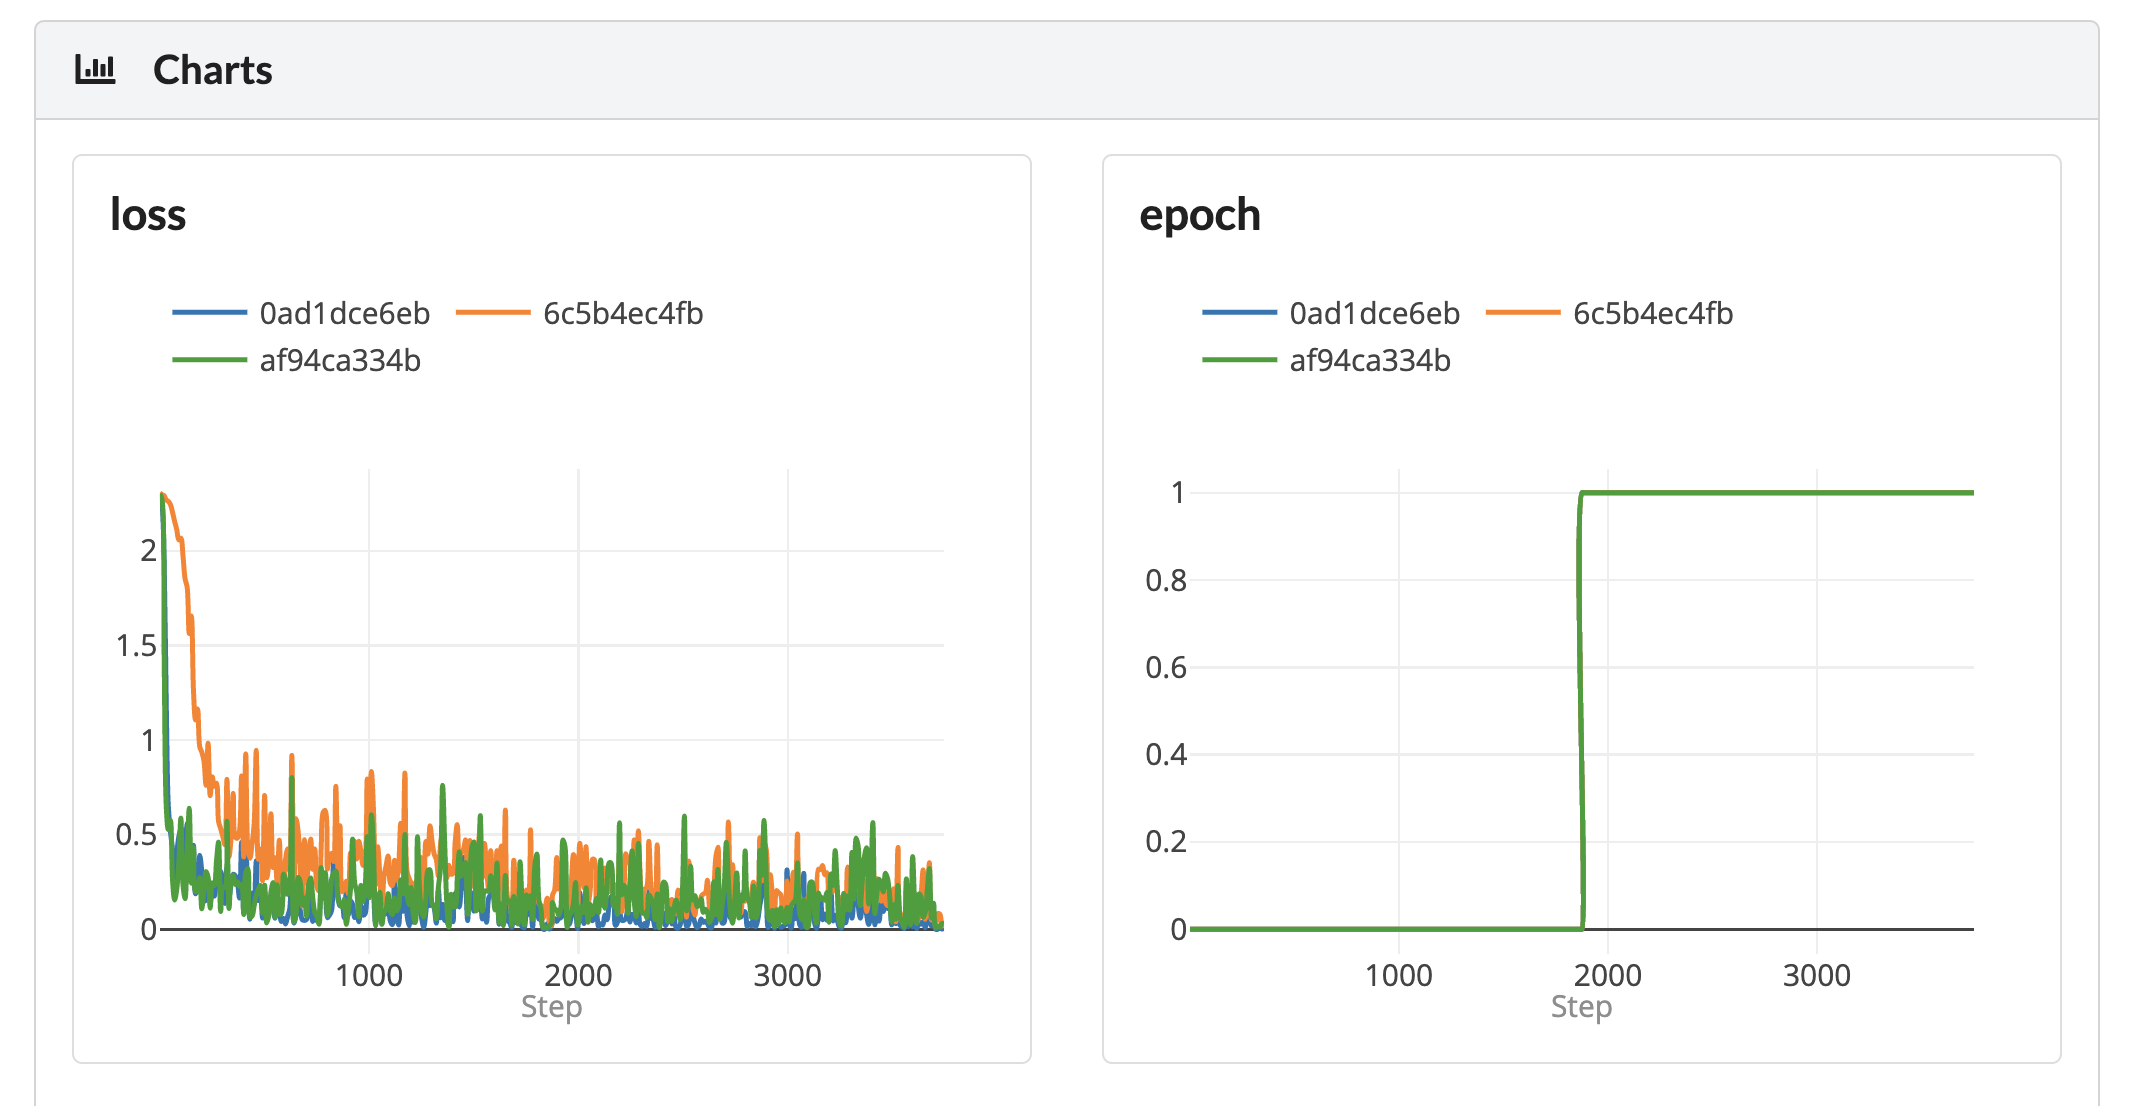 Chart View
Each view is interactive, and you can download the graphs as png files, zoom in on relevant parts by dragging a rectangle on them (double click to zoom back out), or remove experiments from a plot by clicking the experiment name in the legend.
How to create experiments?
DagsHub supports creating experiments using MLflow to log the experiments to the repository's MLflow server. The information will be parsed and shown in the experiment table.