

Visualizing your data
Data Engine provides an easy way to visualize data points and their enrichments. By displaying data with enrichments such as annotations, predictions, and metadata - you can quickly:
- See your data points & better understand your datasets
- Discover use cases, in which your model is underperforming
- Create a new dataset out of it using visual filters
- Send your data for annotation or re-annotation
This way you can make sense of the datasets you’re using to train and improve your model.
DagsHub's Dataset Viewer allows you to visualize datasources, datasets, as well as individual queries. You can select the metadata you'd like to view. It can also overlay annotations for columns in the Label Studio format!
To visualize a query while working with the python client, you can run the following command:
# Query datasource
query = ds["annotation"].is_null()  # query of your choice

# Visualize the quried datasource
query.visualize(visualizer="dagshub")
To visualize queries using just the DagsHub UI, follow the documentation under query and create subsets to utilize the web query builder.
Save query results as a dataset
Once you explore a dataset, you may want to filter out subsets to work with further (e.g. retraining with upweighted loss). Doing so with the DagsHub Dataset Viewer is easy!
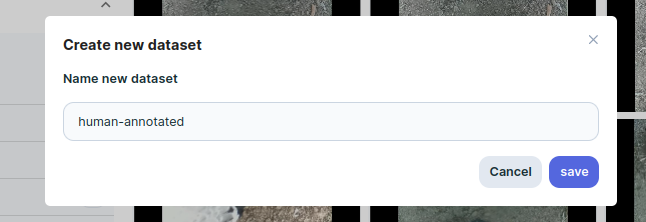
For example: in the sawit dataset project, some data is annotated using a vision model. This is generally less reliable than human annotators. I can filter them out by checking if the annotator field is equal to 'human':

Next, I can save this query as a dataset, giving it an appropriate name:
Once you do the same for your project, use the get_datasets() command or navigate to your repository and check the datasets tab to see your new dataset.
Edit metadata
Metadata can be edited both through the UI, or the python client. To start, select the datapoint you'd like to update:
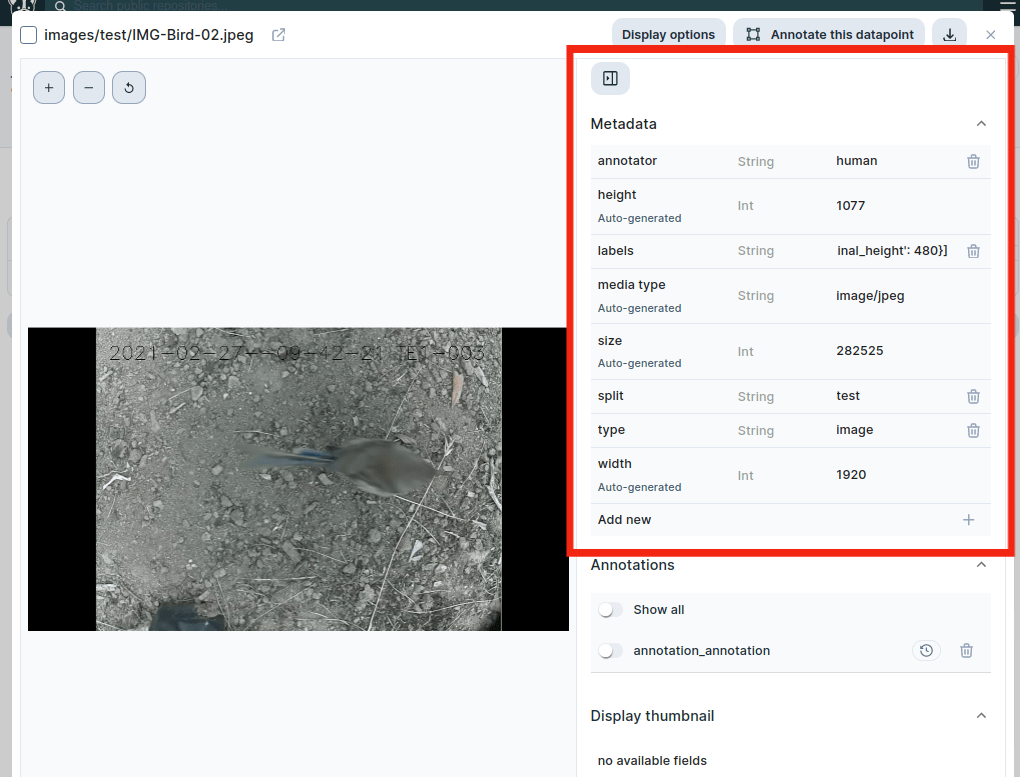
To the left, you see a visualization of this datapoint. To the right, we have the metadata. We can add metadata by updating and adding new fields.
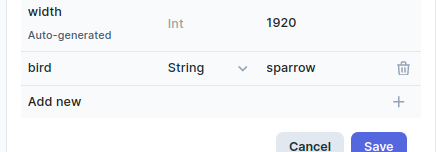
You can add a new field by entering in the field name, setting the type and assigning a value:
To update metadata for a large set of datapoints, it is recommended to follow our documentation on enriching metadata using the client API.
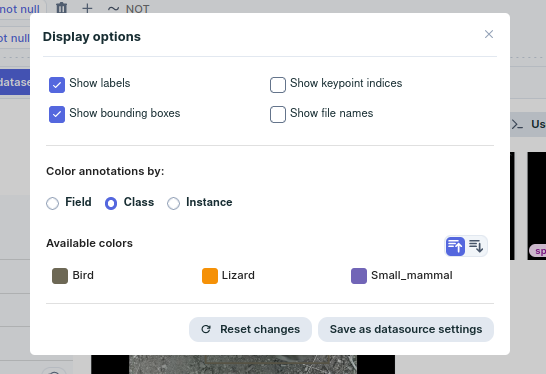
Display Options
From the bar above your datapoints, you can also select Display Options. Here’s what they all do:
- Show labels: Whether or not the labels from LabelStudio should be overlaid over datapoint.
- Show bounding boxes: Whether or not the bounding boxes from LabelStudio should be overlaid over each datapoint.
- Show filenames: Whether or not filenames should overlay over each datapoint.
- Show keypoint indices: Shows the keypoints traced during semantic segmentation.
-
Color annotations by:
- Field: The color is set to the annotation column - different columns have different colors.
- Class: The color is set against the union of all labels in the annotation columns.
- Instance: The color is set by the instance of annotation (the first, second, etc., instances. Annotations are colored left-to-right from the available colors).
Annotate your data or create a dataloader for training
You can also use DagsHub to annotate your datasets or to convert it to a dataloader for training or evaluation.