

MLflow Tracking
MLflow is an open-source tool to manage the machine learning lifecycle. It supports live logging of parameters, metrics, metadata, and artifacts when running a machine learning experiment. To manage the post training stage, it provides a model registry with deployment functionality to custom serving tools.
DagsHub provides a free hosted MLflow server with team-based access control for every repository. You can log experiments with MLflow to it, view its information under the experiment tab, and manage your trained models from the full-fledged MLflow UI built into your DagsHub project.
How does the integration of DagsHub with MLflow work?
When you create a repository on DagsHub, a remote MLflow server is automatically created and configured with the project. The repository's MLflow tracking server will be located at:
https://dagshub.com/<DagsHub-user-name>/<repository-name>.mlflow
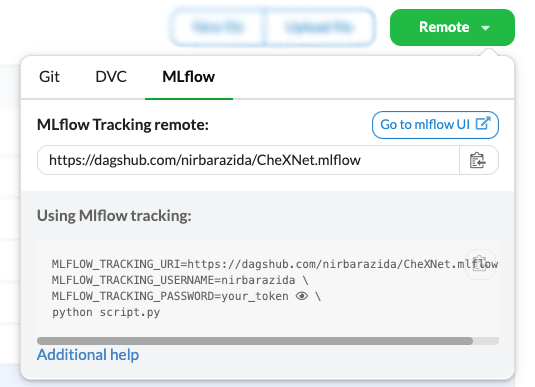
The server endpoint can also be found under the ‘Remote’ button:
Team based access control
- Only a repository contributor can log experiments and access the DagsHub MLflow UI.
How to set DagsHub as the remote MLflow server?
1. Install and import MLflow
-
Start by installing the MLflow python package in your virtual environment using pip:
pip3 install mlflow -
Then, you will import MLflow to our python module using
import mlflowand log the information with MLflow logging functions. .
2. Set DagsHub as the remote URI
You can set the MLflow server URI by adding the following line to our code:
mlflow.set_tracking_uri('https://dagshub.com/<DagsHub-user-name>/<repository-name>.mlflow')
Set the MLflow server URI using an environment variable
You can also define your MLflow server URI using the MLFLOW_TRACKING_URI environment variable.
We don't recommend this approach, since you might forget to reset the environment variable when switching between different projects. This might result in logging experiments to the wrong repository.
If you still prefer using the environment variable, we recommend setting it only for the current command, like the following:
MLFLOW_TRACKING_URI=https://dagshub.com/<username>/<repo>.mlflow python3 <file-name>.py
3. Set-up your credentials
Recommended: Use dagshub.init()
The easiest and recommended way to configure MLflow tracking with DagsHub is using the DagsHub Python client's dagshub.init() function. This function automatically handles both MLflow URI configuration and authentication.
For complete setup instructions and examples, see the Track ML Experiments guide.
Key benefits:
- Automatic MLflow URI and authentication configuration
- Works seamlessly across all environments (local, Jupyter, Colab, CI/CD)
- No manual environment variable management needed
- Integrates with DagsHub's authentication system
Alternative: Manual MLflow Configuration
If you prefer manual control or need to integrate with existing MLflow code, you can configure authentication using environment variables.
The DagsHub MLflow server has built-in access controls. Only a repository contributor can log experiments
(someone who can git push to the repository).
In order to use basic authentication with MLflow, you need to set the following environment variables:
MLFLOW_TRACKING_USERNAME- DagsHub usernameMLFLOW_TRACKING_PASSWORD- DagsHub password or preferably an access token
For terminal/shell environments:
export MLFLOW_TRACKING_USERNAME=<username>
export MLFLOW_TRACKING_PASSWORD=<password/token>
For Python scripts and notebook environments (Jupyter, Google Colab):
Use Python's os.environ to set environment variables directly in your code:
import os

os.environ['MLFLOW_TRACKING_USERNAME'] = '<username>'
os.environ['MLFLOW_TRACKING_PASSWORD'] = '<password/token>'
Important for Notebook Users
Do NOT use shell commands in notebook environments:
# ❌ This does NOT work in Jupyter/Colab notebooks:
!export MLFLOW_TRACKING_USERNAME=<username>
!export MLFLOW_TRACKING_PASSWORD=<password>
Why? Shell commands (prefixed with !) run in a separate subprocess. Environment variables set this way are not accessible to your Python kernel.
✅ Always use os.environ in Python/notebook code:
import os
os.environ['MLFLOW_TRACKING_USERNAME'] = '<username>'
os.environ['MLFLOW_TRACKING_PASSWORD'] = '<password/token>'
For Google Colab with secure token storage:
Store your token in Colab Secrets and retrieve it securely:
import os
from google.colab import userdata

os.environ['MLFLOW_TRACKING_USERNAME'] = '<username>'
os.environ['MLFLOW_TRACKING_PASSWORD'] = userdata.get('DAGSHUB_TOKEN')
You can also use your token as username; in this case the password is not needed:
export MLFLOW_TRACKING_USERNAME=<token>
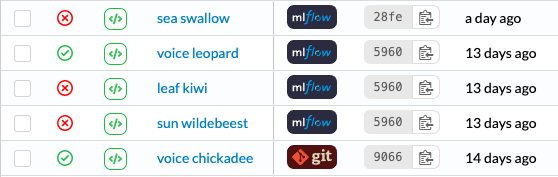
Congratulations, you are ready to start logging experiments. Now, when you run your code, you will see new runs appear in the experiment tables, with their status and origin:
How to log models and artifacts to DagsHub?
Info
MLflow experiments created before August 10th 2022 won't be affected by that change. This means you cannot log artifacts using this technique for your existing Default MLflow experiment. If you already have a repository with MLflow runs, the recommended way to start using the proxy artifacts is by creating a new experiment through the MLflow CLI, the Python client, or the MLflow UI.
Option 1: Use DagsHub Storage
DagsHub's MLflow integration supports directly logging artifacts through the tracking server.
In the past the MLflow tracking server used to manage the location of artifacts and models,
but uploading and downloading was done using the client's local credentials and available
packages (i.e boto3 or google-cloud-storage).
Support for proxying upload and download requests through the tracking server was added in MLflow 1.24.0.
DagsHub lets you leverage this capability by directly hosting your artifacts by default.
For every newly created repository or MLflow experiment,
DagsHub will generate a dedicated artifact location similar to mlflow-artifacts:/<UUID>.
Option 2: Use external buckets
DagsHub's tracking server allows you to specify AWS S3 buckets for storing artifacts for newly created MLflow experiments. In order to configure this, you must create a new experiment and provide an s3:// URI as the artifact store. You can either do this by clicking the "Create Experiment (+)" button in the DagsHub MLflow UI, and entering the artifact location in the dialog box, or running the following python code.
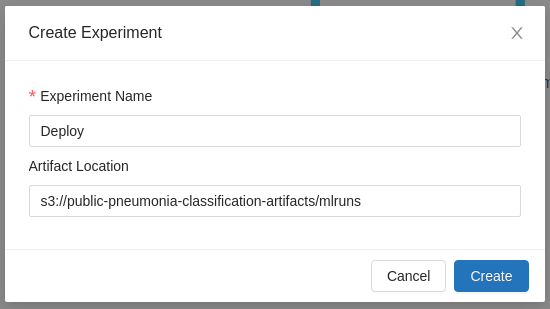
Set up MLflow
import mlflow
artifact_location = f"s3://{s3-bucket-name}/mlruns"
mlflow.create_experiment("Deploy", artifact_location)
Once the experiment is created, you must tell your code to select it over the default experiment. You can do this either by setting the environment variable
export MLFLOW_EXPERIMENT_NAME=Deploy
or adding this line of python code to your training code:
mlflow.set_experiment(experiment_name="Deploy")
Set up AWS
Before logging models or other artifacts to MLflow, you will need to download the boto3 package to allow MLflow to interact with the AWS S3 API.
pip3 install boto3
You'll also need to ensure that your code has the required permissions to upload files to AWS S3. Obtain an AWS Access Token (consisting of a pair of an Access Key ID and a Secret Access Key), then either set them as the AWS_ACCESS_KEY_ID and AWS_SECRET_ACCESS_KEY environment variables, or run the aws configure command to save them on the filesystem.
Securely providing AWS credentials
If you don't want to give your code permanent AWS credentials, you could make use of aws-vault to provide time-limited temporary tokens instead.
Doing all this will allow you to call mlflow.log_artifact() or mlflow.autolog(log_models=True) to instruct MLflow to upload models or other artifacts to the artifact store and note their locations on the tracking server.
How to launch the DagsHub MLflow UI
The DagsHub MLflow tracking server provides access to the MLflow server user interface (MLflow UI). To view the MLflow UI, visit the tracking server URI (https://dagshub.com/<username>/<repo>.mlflow) in a browser. If you haven't interacted with the main DagsHub interface in a while, you may have to enter your DagsHub username and password/access token in to the authentication popup shown by your browser.
You should have full access to all views and actions provided by the MLflow UI. This includes viewing run details, comparing runs (within the same experiment only, to compare runs across experiments, visit the DagsHub experiment tracking interface), creating and managing experiments, and viewing and updating the model registry.
How to deploy an MLflow model using DagsHub?
DagsHub's MLflow integration includes support for logged artifacts and the MLflow model registry. With this, you can use MLflow to deploy your trained models as batteries-included inference servers to the cloud with ease.
How to register MLflow model in DagsHub Model Registry?
Once you have logged a model as part of an MLflow run, you can save that model to the Model Registry for your repository. You run the following python code to do so:
import mlflow
run_id = '<run-id-here>'
artifact_name = 'model'
model_name = '<name-of-model-in-model-registry>'
mlflow.register_model(f'runs:/{run_id}/{artifact_name}', model_name)
How to deploy an MLflow model from DagsHub Model Registry?
Once the model is registered as a part of the DagsHub Model Registry, you can make use of standard MLflow tooling to deploy the model as a container, on AWS SageMaker, Azure ML, Apache Spark UDF, or any other platform.
Simply follow the instructions provided by MLflow to do so.
Process to deploy an MLflow model to Amazon AWS SageMaker
mlflow sagemaker build-and-push-container
mlflow sagemaker deploy \
    -m "models:/<name-of-model-in-model-registry>/latest" \
    -a <sagemaker-deployment-name> \
    --region-name <aws-region> \
    -e <sagemaker-role-arn> \
    --mode replace
Process to build a Docker container image from an MLflow model
mlflow models build-docker \
    -m "models:/<name-of-model-in-model-registry>/latest" \
    -n <name-of-docker-image> \
    --enable-mlserver
To run inference server locally:
docker run -p 80:8080 <name-of-docker-image>
Process to deploy an MLflow model to Microsoft Azure ML
mlflow deployments create \
    --name <azureml-deployment-name> \
    -m "models:/<name-of-model-in-model-registry>/latest" \
    -t <azureml-mlflow-tracking-url> \
    --deploy-config-file <(echo '{"computeType":"aci"}')
How To Use MLflow In A Colab Environment?
We shared two examples of experiment logging to DagsHub’s MLflow server in a Colab environment.
How to import MLflow local objects to DagsHub MLflow remote?
Generally, you can use mlflow-export-import to export MLflow experiments, runs and models from one server to another.
The following example demonstrates how to bulk export all objects that are created locally, then bulk import to DagsHub remote tracking server.
1. Install mlflow-export-import
-
In the same environment that you originally install
mlflow, you can installmlflow-export-importwith:pip install mlflow-export-import -
If you need to install the latest version from Github source, do this instead:
pip install git+https://github.com/mlflow/mlflow-export-import
2. Export all local objects
-
In one terminal, start the local
mlflowserver, for example with:mlflow server --host 0.0.0.0 --port 8888 -
In another terminal, in the same virtual environment, export all objects to a folder called
mlflow-exportwith:# note: the port needs to be same one that you request in the other terminal MLFLOW_TRACKING_URI=http://localhost:8888 \ export-all --output-dir mlflow-export -
If succeeded, you should see a report saying so, for example
3 experiments exported 37/37 runs succesfully exported Duration for experiments export: 10.6 seconds Duration for entire tracking server export: 10.8 seconds -
At this point, you can stop the local server in the first terminal.
3. Import to DagsHub server
- Find your DagsHub repository's MLflow remote variables, for example by going through the
Remotebutton in your repository, then click on theExperimentstab. -
Do the following in terminal:
MLFLOW_TRACKING_URI=https://dagshub.com/<USER>/<REPO>.mlflow \ MLFLOW_TRACKING_USERNAME=<USER> \ MLFLOW_TRACKING_PASSWORD=<PASSWORD_OR_TOKEN> \ import-all --input-dir mlflow-export -
If successful, you can launch the local server again, and visit
https://dagshub.com/<USER>/<REPO>.mlflowto inspect if there are any discrepancies between the logged data, artifacts, models, runs, experiments. For example, see if there's anything missing.
Importing issues & workarounds
There may be some issues with in Step 3 with importing. Below are some potential workarounds to try, essentially by editing the package source codes after installation.
Warning
- These workarounds are used with
mlflow-export-import 1.2.0. In the future, these may be patched. - These workarounds may work for only certain cases and issues.
- You should backup
mlflow-exportdirectory just in case. - Always try to compare the local server and DagsHub remote tracking server after every
import-allstep to ensure they are the same.
-
First, find the source code directory by inspecting at the
Locationfield when doingpip show, for example:pip show mlflow-export-import ... Location: .venv/lib/python3.10/site-packages/mlflow_export_import ...Alternative to editing in
site-packagesThe alternative to editing source codes in
site-packagesis using editable installation withmlflow-export-import.# clone the repository git clone https://github.com/mlflow/mlflow-export-import # install in editable mode pip install -e ./mlflow-export-import/Then you can edit files in the local
mlflow-export-import/mlflow_export_importdirectory instead of your environment'ssite-packagesdirectory. -
If you see
{'error_code': 'BAD_REQUEST'}in the outputs ofimport-all, comment out/delete the following lines incommon/mlflow_utils.pyfile, underset_experimentfunctionif ex.error_code != "RESOURCE_ALREADY_EXISTS": raise MlflowExportImportException(ex, f"Cannot create experiment '{exp_name}'") -
Re-run Step 3 with the same
import-allcommand again. -
If you still encounter issues, it could be because your local experiments did not log any data inputs. If none of your experiments did, attempt to comment out/delete the following line in
run/import_run.pysource file, underimport_runfunction, inside thetryblock_import_inputs(http_client, src_run_dct, run_id)Warning
Please note that this workaround assumes none of your experiments or runs log any inputs.
If there are some that do and some that do not, you will need to modify the logic of
_import_inputsand/or the code surround this line to accommodate that. -
Re-run Step 3 with the same
import-allcommand again.
If there are still issues or there are discrepancies between the local server and the remote DagsHub server, please open a ticket on DagsHub and/or mlflow-export-import Github repository.
Known Issues, Limitations & Restrictions
The MLflow UI provided by DagsHub currently doesn't support displaying artifacts pushed to an external storage like S3. Please, contact us in our Discord channel if you find it important.