Identifying Model Weaknesses in Your Data with DagsHub Data Engine
- Yono Mittlefehldt
- 6 min read
- 3 years ago

If you’ve read our post outlining Top Challenges in Data Management for Machine Learning Projects, you’ll already be familiar with the fictional startup, RecyclingHub.
To recap, RecyclingHub’s mission is to make recycling more efficient and cheaper through machine learning. They would like to improve their models by improving the quality of their data. However, like many companies with growing data science departments, the process of collecting, annotating, reviewing and serving the data for training keeps presenting new problems and pain points.
Our friends at RecyclingHub need to get a handle on their data management problems. Specifically, they’ve realized that their datasets need to be dynamic and need a way to track metadata and annotation changes. Their current solution is a pile of tools, cobbled together. It’s brittle, slow, and not at all cohesive. They need to make a change.
RecyclingHub decides to use DagsHub Data Engine, as it has an intuitive Python API, can easily slice and query their data any way they see fit, and will allow them to implement a robust active learning pipeline. Data Engine is flexible enough to grow with them as their data needs grow.
Since their images and annotations are already stored on an S3 bucket, adding them to a DagsHub repo is easy.
Although RecyclingHub already has some models in production, they would like to try out their new Data Engine workflow from start to finish, to ensure they understand the system they envision.
Train Initial Model
With their data and code ready to go on DagsHub, RecyclingHub is eager to get started. They want to train an initial model on their current data and compare it to their production model.
This will give them confidence in the new workflow.
Adding a new data source
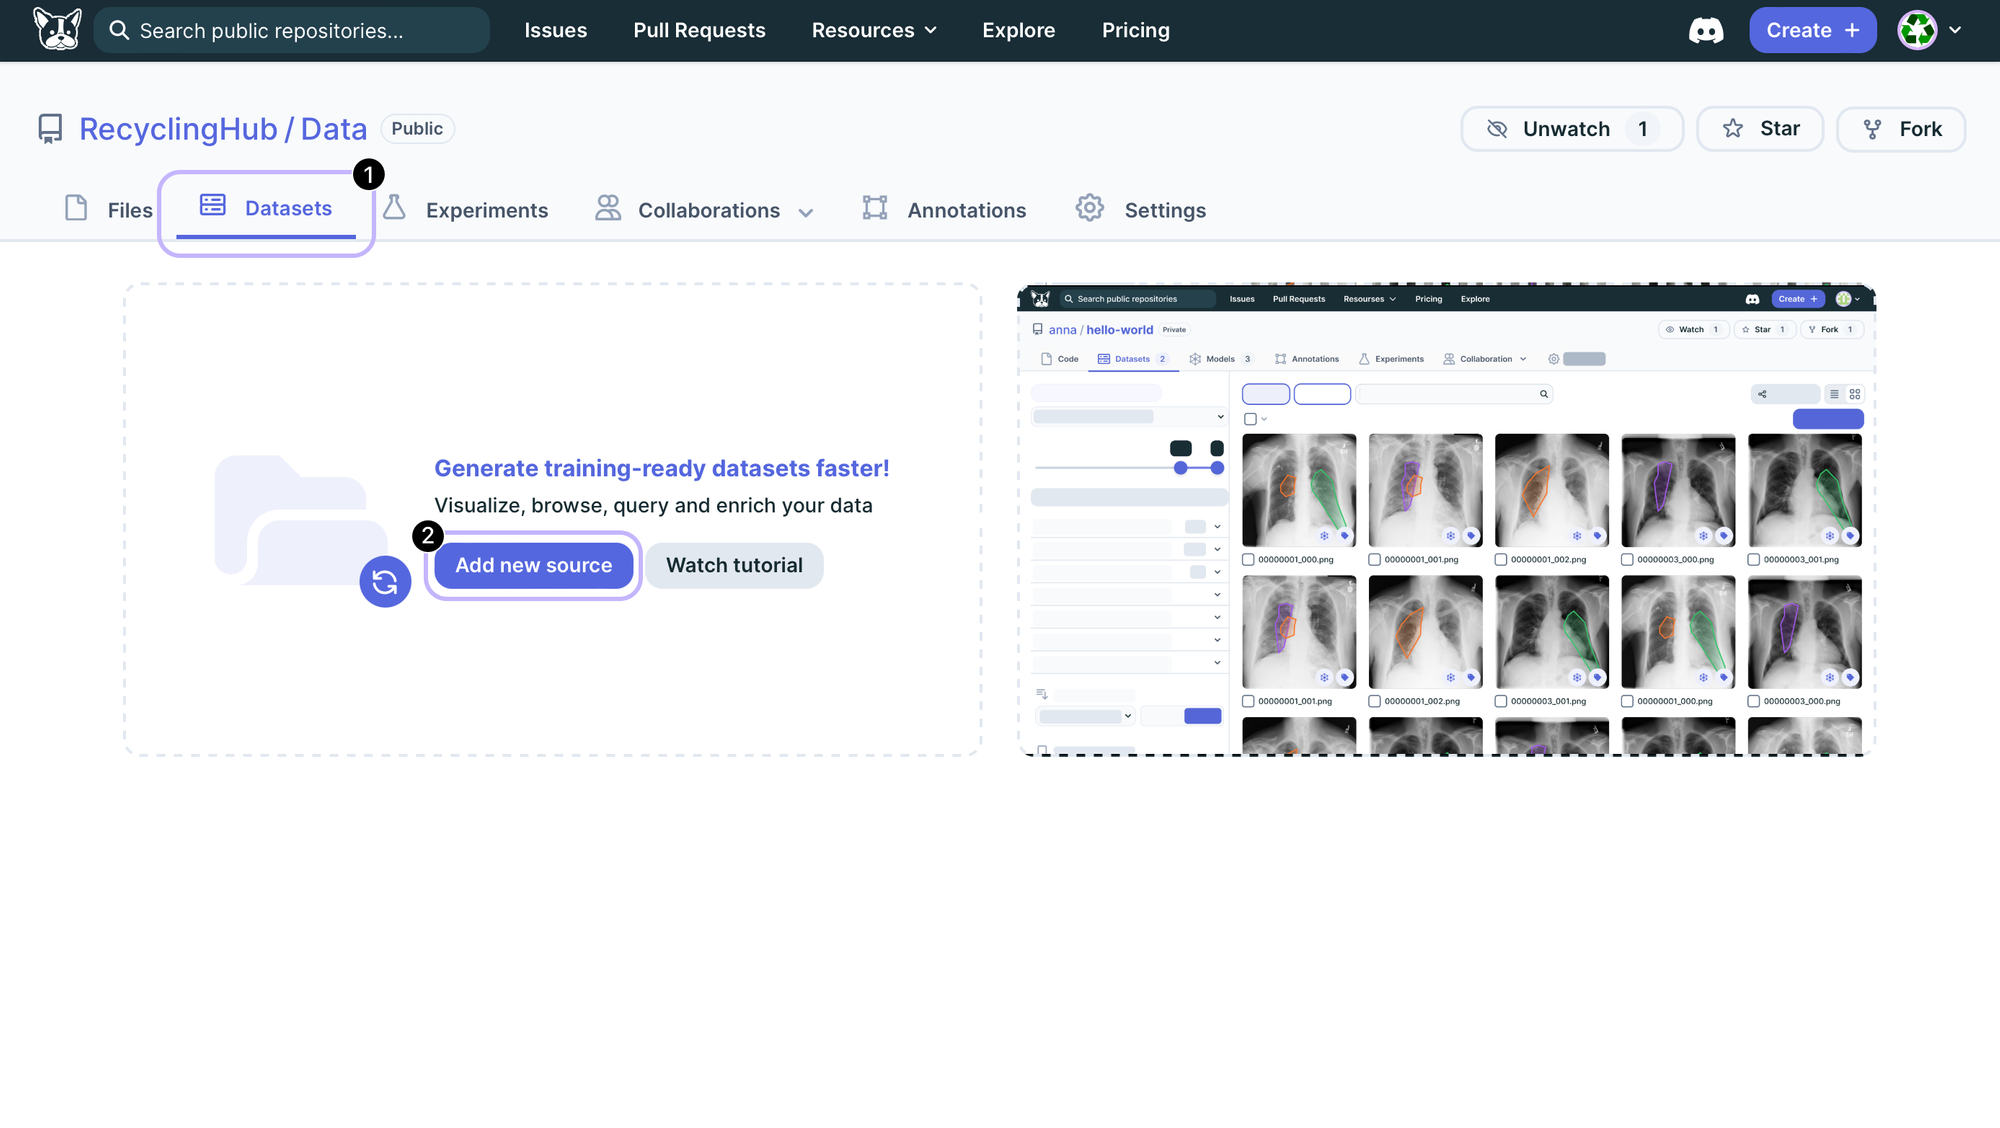
The first step is to add a new data source. The data is already available on the repo, but adding it as a source in the Data Engine will allow them to use the data, filter it, and subset it as necessary for their needs.
This can be done either via the web interface:
or via code:
from dagshub.data_engine.model import datasources
from dagshub.streaming import install_hooks

repo = "RecyclingHub/Data"
image_root = "s3://recyclinghub-data/data"
try:
    ds = datasources.get_datasource(repo=repo, name="images")
except:
    ds = datasources.create_from_repo(repo=repo, name="images", path=image_root)
Associating metadata with each image
Once this data source has been created, they can add metadata to it based on their annotations and knowledge of the dataset:
annotations = [...]

with ds.metadata_context() as ctx:
    # 1
    for ann in annotations:
        obj_by_class = {}
        obj_counts = {}

        # 2
        for obj in ann['objects']:
            label = obj['class']

            if label not in obj_by_class:
                obj_by_class[label] = []
            obj_by_class[label].append(obj)

						obj_counts[label + '_count'] = obj_counts.get(label + '_count', 0) + 1

        # 3
        total_count = len(ann['objects'])

        # 4
        metadata = {k: True for k in obj_by_class.keys()}
        metadata.update(obj_counts)
        metadata['total_objects'] = total_count
				metadata['customer'] = ann['customer']

        #5
        ctx.update_metadata(ann['image'], metadata)
In this example, RecyclingHub is:
- Looping through their annotations, which is a list of dictionaries,
- Add objects and object counts found in the image to some dictionaries,
- Getting the total number of objects labeled in the image,
- Setting up a metadata dictionary with relevant key-value pairs, and
- Updating the metadata for the datasource
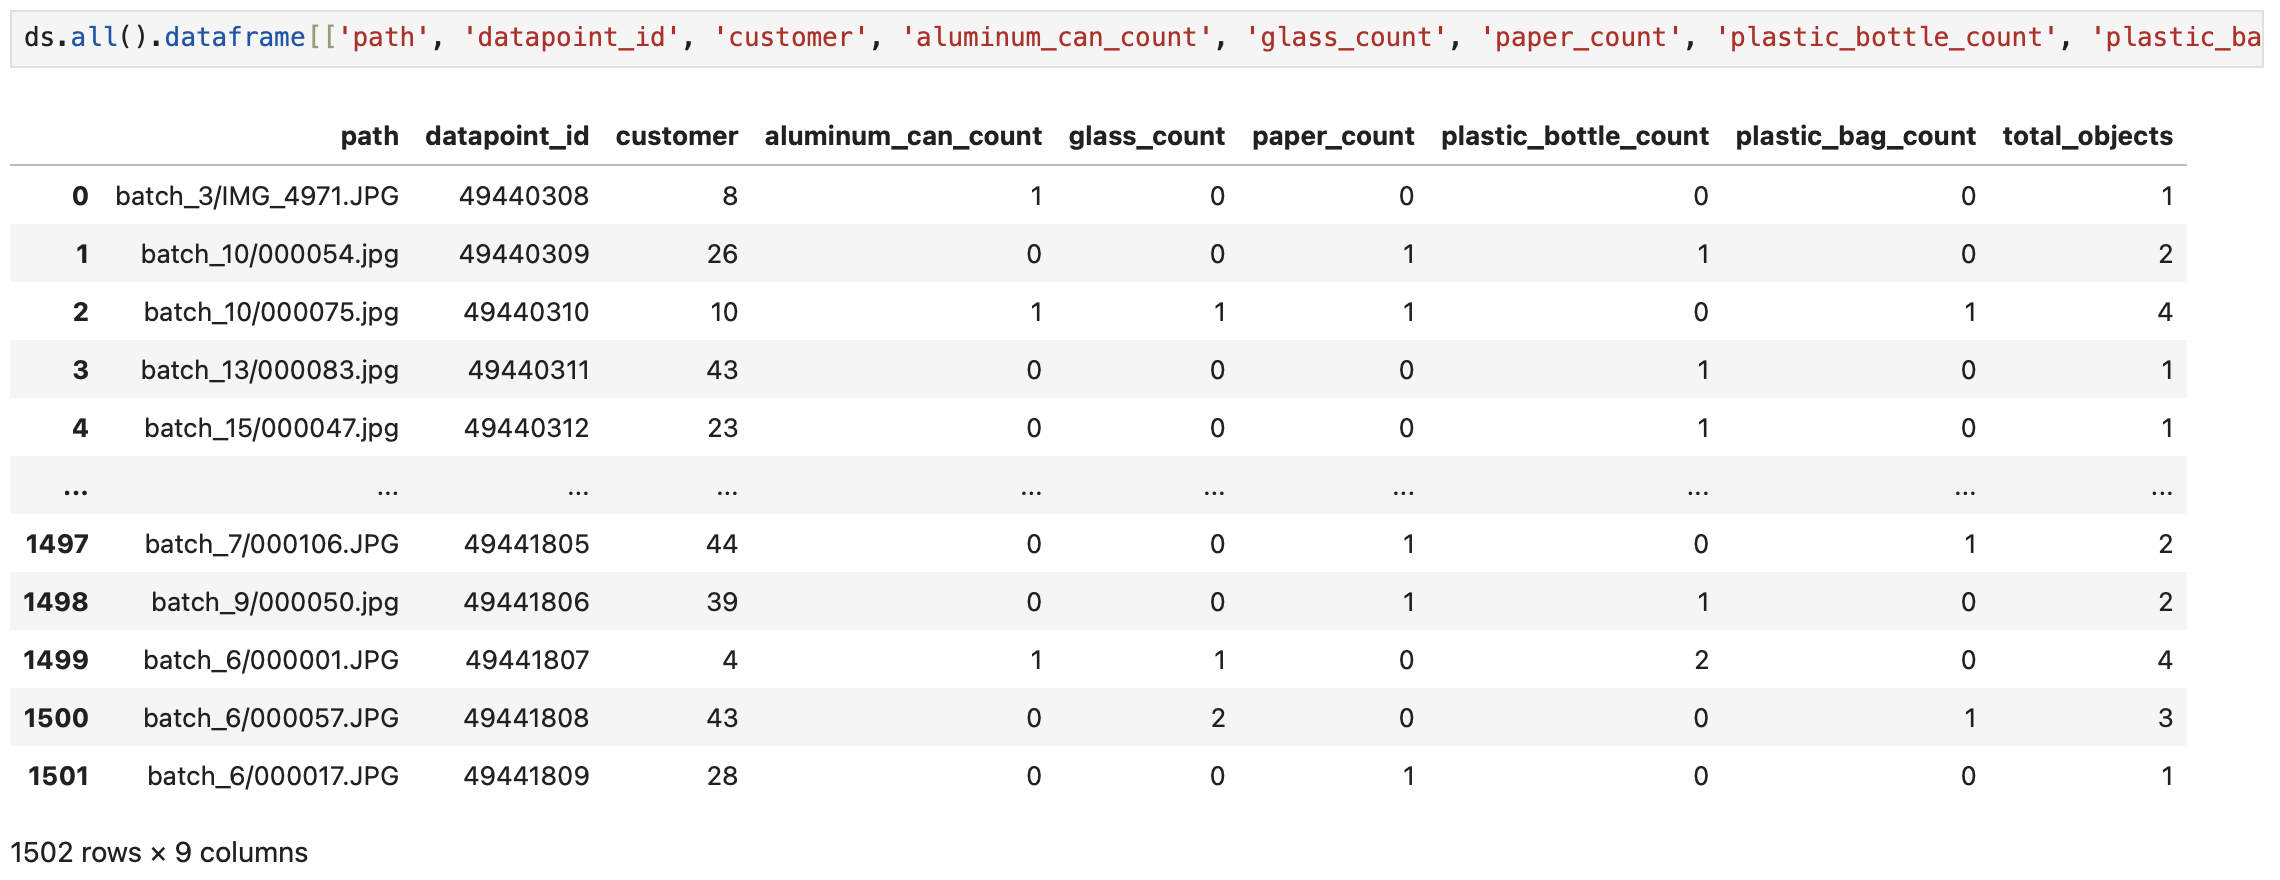
If we convert our dataset to a Pandas DataFrame, it looks something like:
Filtering data source into a dataset
Now with their initial metadata available, RecyclingHub can filter the data source into a dataset. For this particular model, they would like to focus on plastic bottles.
They filter the dataset using the following code:
data_subset = (ds["plastic_bottles_count"] > 0)
This gives them a subset of their data containing only images with plastic bottles.
Converting to a DataLoader for training
They can then use Data Engine to automatically generate a PyTorch (or TensorFlow) DataLoader:
dataset_tr = data_subset.as_dataset(flavor='torch', metadata_columns=['plastic_bottles'])
dataloader = data_subset.as_dataloader(dataset_tr, tensorizers='auto')
This dataloader can then be directly used in training.
# log training parameters to MLflow
...

with X, y in dataloader:
    # training code here
		...
    # log training metrics to MLflow
		...

# register trained model to MLflow's Model Registry
...
During training, RecyclingHub makes sure to log their training parameters, metrics, and trained model to their repo’s MLflow server, which comes with every DagsHub repo.
This will allow them to compare future training runs and tie them to the code and data that was used to generate the models.
Real Life Feedback
After a few weeks, RecyclingHub checks in on how their new model is performing in production. They speak to some customers who are completely happy, but a few customers are noticing some issues.
RecyclingHub needs to to determine what is going wrong for those customers.
Investigation
The first thing they do, is ask the customers to send over some data. The data is key to understanding what went wrong.
Data scientists at RecyclingHub want to visualize this new data to see if they can understand the problem holistically.
They follow the workflow they put in place when integrating Data Engine:
- First, they add the new data to their data source.
- Next, using the same model their customer uses, they run inference on all the data. This is done using a Label Studio-compatible ML backend, to run predictions.
- Then, they update the metadata for the new images using this inference data
In addition to adding metadata based on the inference, to help debug the issue, the RecyclingHub data scientists also add new types of metadata to these images including:
time- time of day the image was takencustomer- customer IDresolution- image resolutioncamera- camera used
This information may or may not be useful in figuring out the problem with the model.
For instance, maybe the time of day will hint at images taken mostly at night. If most of the training set images were taken in daylight, then perhaps the model has issues with those taken at night.
Or perhaps the camera used has different intrinsic properties from the ones used for the training data. This could be a source of model errors, as well.
The data scientists can then filter the data by the customer IDs, since they know which customers sent the failing data.
failing_data_subset = (ds["customer"] == 13) | (ds["customer"] == 36) | (ds["customer"] == 42)
Visualizing
Once they filtered the data, they can visualize locally on their machine it by running:
failing_data_subset.visualize()
The output of this looks like:
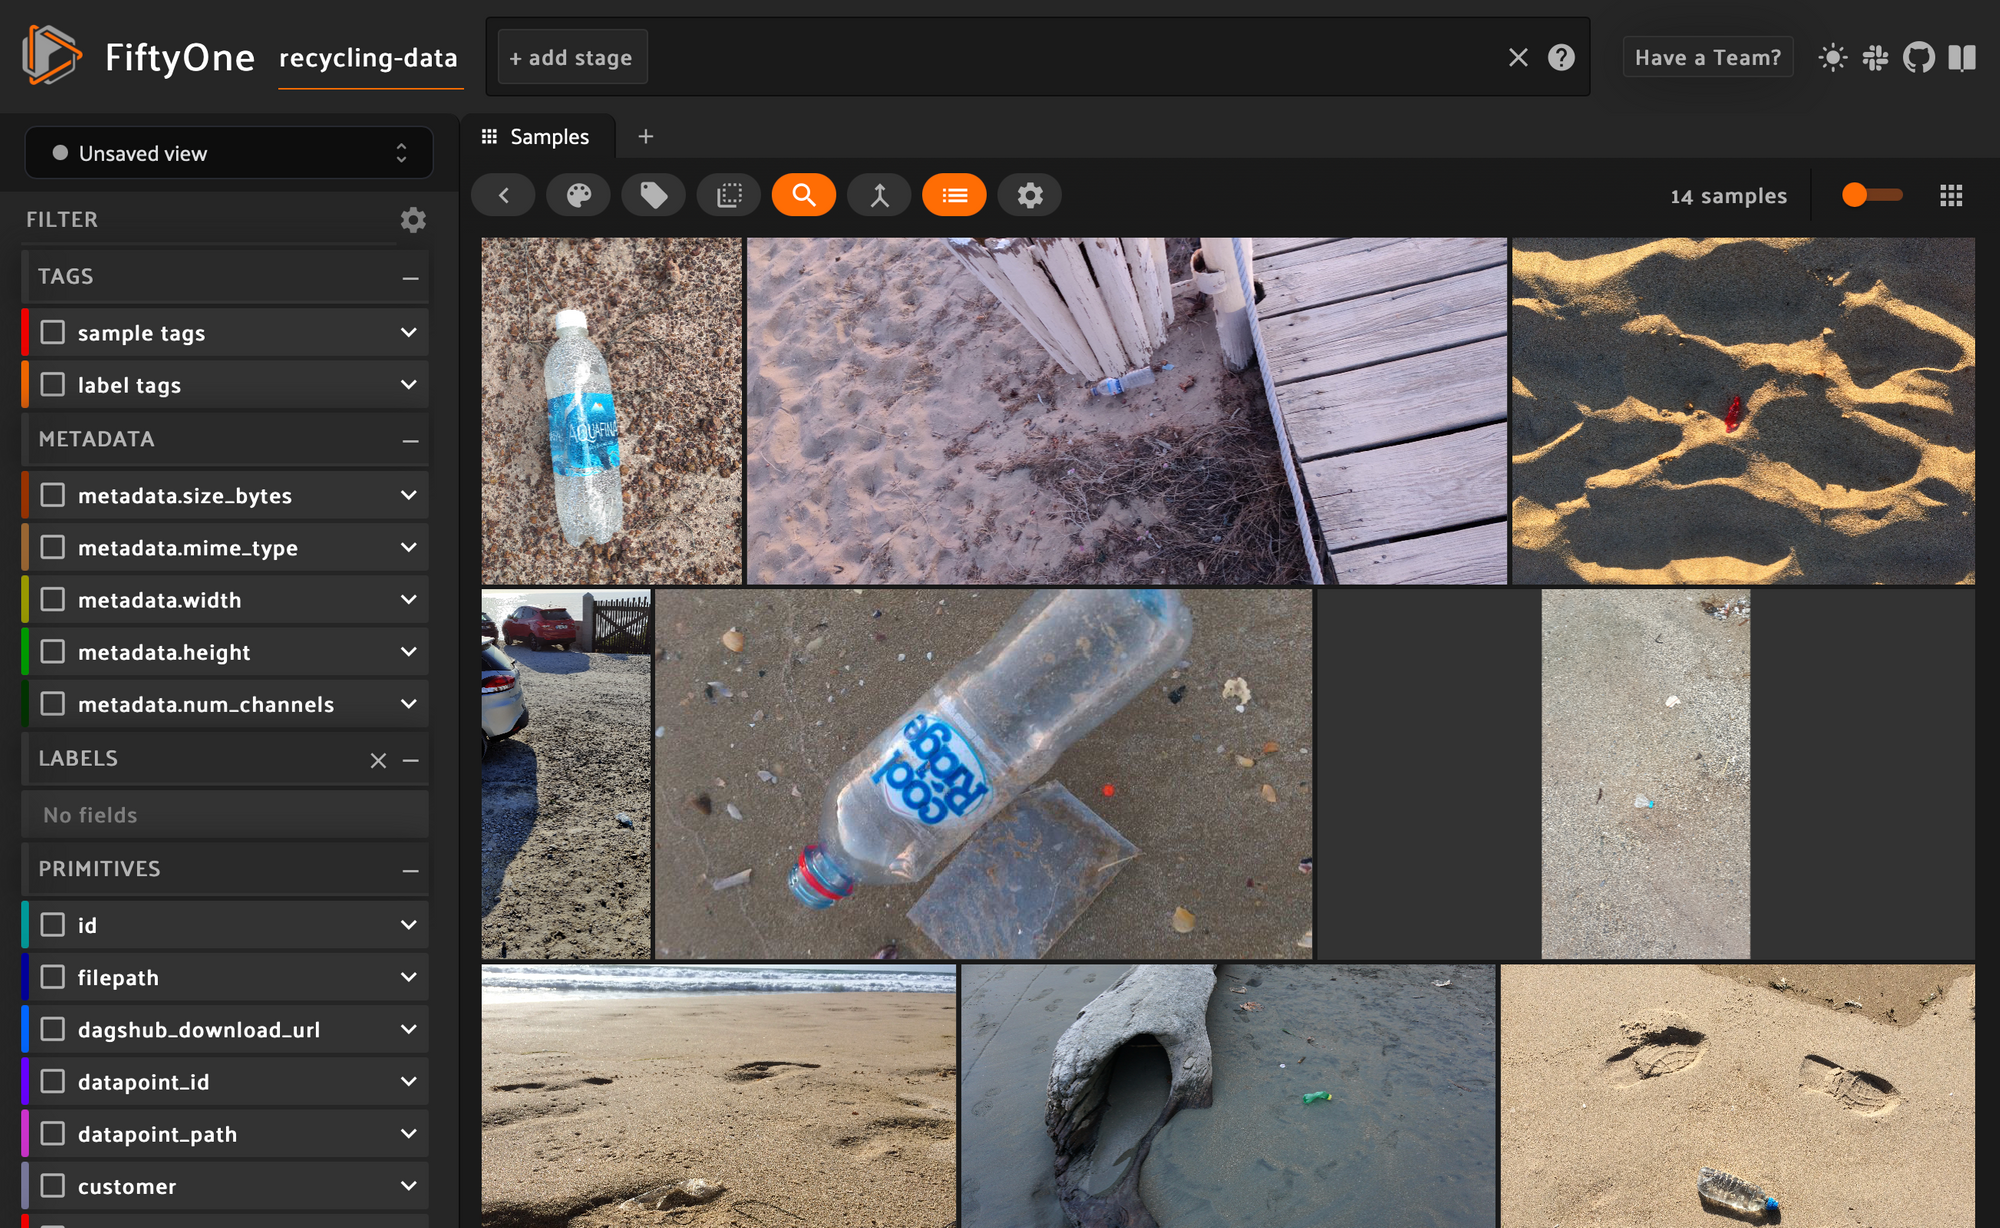
The first thing that struck the data scientists is that most of the failing images are of plastic bottles on the beach. When they check their training set, they find they had few to no images of plastic bottles on beaches.
One theory they come up with is that sand sticking to a clear plastic bottle makes it no longer appear as a plastic bottle to the model.
Add Data + Annotations
To fix this, the data scientists at RecyclingHub annotate these new images their customers sent them. They start with the model’s predictions, as, in some cases, they’re better than starting from nothing.
Using Label Studio, they split up the labeling work among the team and add the annotations for the new images. Due to DagsHub's integration with Label Studio, they are able save annotations back to the dataset directly.
Train New Model
After annotation, it’s time to train a new model. Using the same process when training the initial model, RecyclingHub is able to kick off training very quickly. They are then able to use MLflow to compare models quickly and verify that the new ones are better for their customers.
In fact, the entire cycle for identifying the model weakness and correcting it is much smoother than their previous workflow. Everything is integrated and optimized for situations like this.
The new model is sent out to customers and RecyclingHub can continue their work on other models. Should further model weaknesses be found, the data scientists feel confident that their new workflow using Data Engine will allow them to turn around solutions much more quickly. This also makes their customers happy.
Are you facing similar data management issues as RecyclingHub? Are you interested in giving Data Engine a try?
The code snippets and screenshots in this post should help you get started, but we have other blog posts and documentation you can check out, too.
We’ve put a lot of work into Data Engine and are proud of what we’ve accomplished. There’s also more to come 😉
Have any questions? Thoughts? Suggestions?
Join our Discord Community and let us know. We’d love to hear them.


