How to use DagsHub with PyCaret
- Nir Barazida
- 5 min read
- 4 years ago
MLOps Team Lead @ DagsHub

Our new integration with PyCaret is making waves in the data science community, and it's only been out for a week! The integration allows Pycaret users to log metrics, parameters, and data to DagsHub's remote servers using MLflow, DVC, and DDA. This enables users to share experiments with teammates, make data-driven discussions, and reproduce results with a click of a button.
In this blog, we'll cover how to use DagsHub Logger with PyCaret and log experiment to DagsHub. We will use the stock forecasting example with PyCaret's time series forecasting module.
What is the workflow of PyCaret and DagsHub?
To use the DagsHub Logger with PyCaret, you only need to set the log_experiment parameter to dagshub when initializing your PyCaret experiment. For example:
from pycaret.datasets import get_data
from pycaret.regression import *

data = get_data('diamond')

s = setup(data,
          target = 'Price',
          transform_target=True,
          log_experiment="dagshub",
          experiment_name='predict_price',
          log_data=True)
If the DagsHub Logger is not already authenticated on your local machine, the terminal will prompt you to enter the repo_owner/repo_name and provide an authentication link. Then the repository and remote MLflow server will be initialized in the background and configured with the local machine. From now, all the experiments you run with PyCaret will be logged with MLflow to DagsHub! Moreover, if you mark log_data=True, DagsHub Logger will also version the raw and processed data with DVC & DDA and push it to DagsHub.
Time Series Forecasting with PyCaret and DagsHub
In this section, we'll get familiar with PyCaret's workflow and how to use it with DagsHub Logger. For that, we'll use the time series forecasting module on the stock datasets.
Library installation
As PyCaret doesn't come with the dependency of DagsHub Client and MLflow, we need to install it for the project.
pip install pycaret
pip install dagshub
pip install mlflow
The stock data comes from the yfinance library. Yfinance offers a threaded and Pythonic way to download market data from Yahoo! finance. We will use BTC-USD as an example. The model we’re using for this example is the prophet, one of the SOTA time-series models from Meta. Note that both yfinance and prophet should also be pre-installed:
pip install yfinance
pip install prophet
Get Stock data from yfinance
Users can choose any kind of stock (ex. BTC-USD, ETH-USD) as long as they are supported by Yahoo! finance. The end date represents the last date of the data and the period is the duration between the start date and the end date. The interval defines the sampling frequency of the data.
EDA with Plotly
We use plotly, an interactive plot library, for data visualization. The interactive candlestick chart provides the open, closed, high, and low prices. With the cursor hovering on the specific date you want to take a look at, an annotation box will pop out with the stock information on that date.
import plotly.graph_objects as go
fig = go.Figure(data=[go.Candlestick(x=data['Date'],
                open=data['Open'],
                high=data['High'],
                low=data['Low'],
                close=data['Close'])])

fig.update_layout(title_text=f"Stock_Number: {Stock_Number}")
fig.show()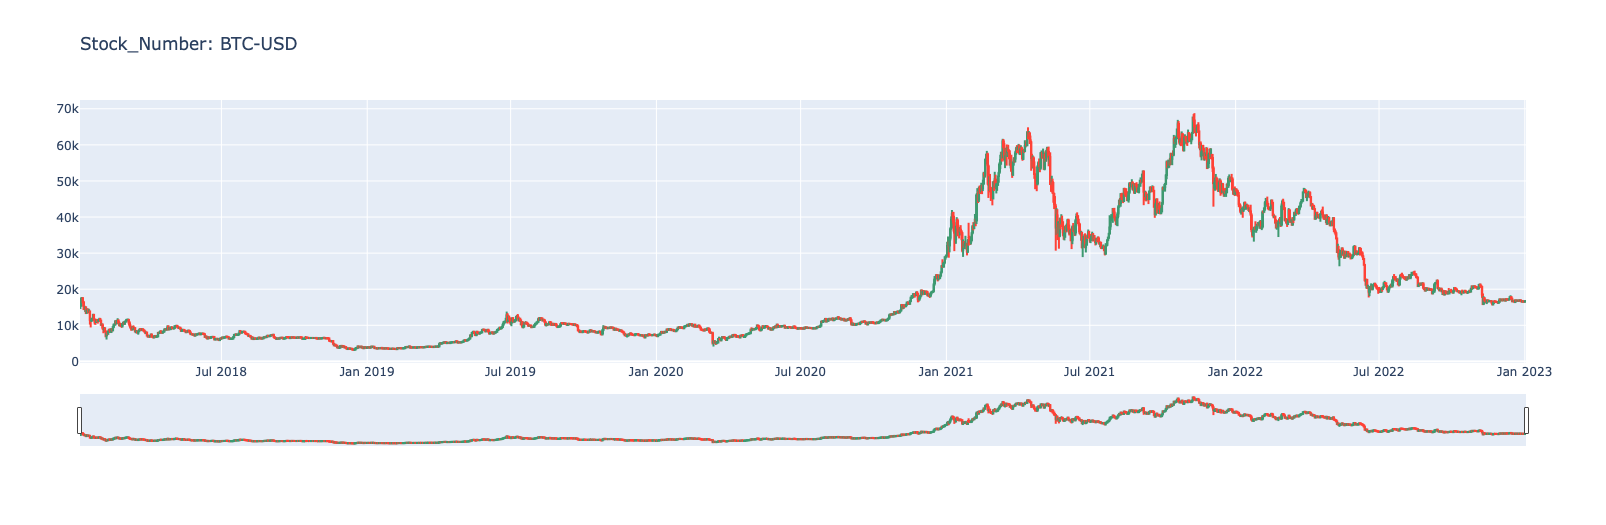
Setup DagsHub Logger with PyCaret
We authorize PyCaret to log into DagsHub by setting log_experiment=”dagshub”.
from pycaret.time_series import *

ts = TSForecastingExperiment()
ts.setup(
      data=train,
      target=target,
      fh=ROLLING_WINDOW,
      fold=FOLD,
      enforce_exogenous=False,
      numeric_imputation_target="ffill",
      session_id=31,
      log_experiment='dagshub',
      log_data=True,
      experiment_name="stock_forcast"
    )
Authentication
As we run the setup, the terminal will pop out go to <authorize_url> for authentication. Follow the link and click on accept to get permission for all DagsHub API access to your account.
Set up DagsHub repo
As we finish the authorization process, the terminal will pop out a prompt asking for the repo owner and repo name:
Please insert your repository owner_name/repo_name:
Note: DagsHub will automatically create a repository if the repo doesn't exist.
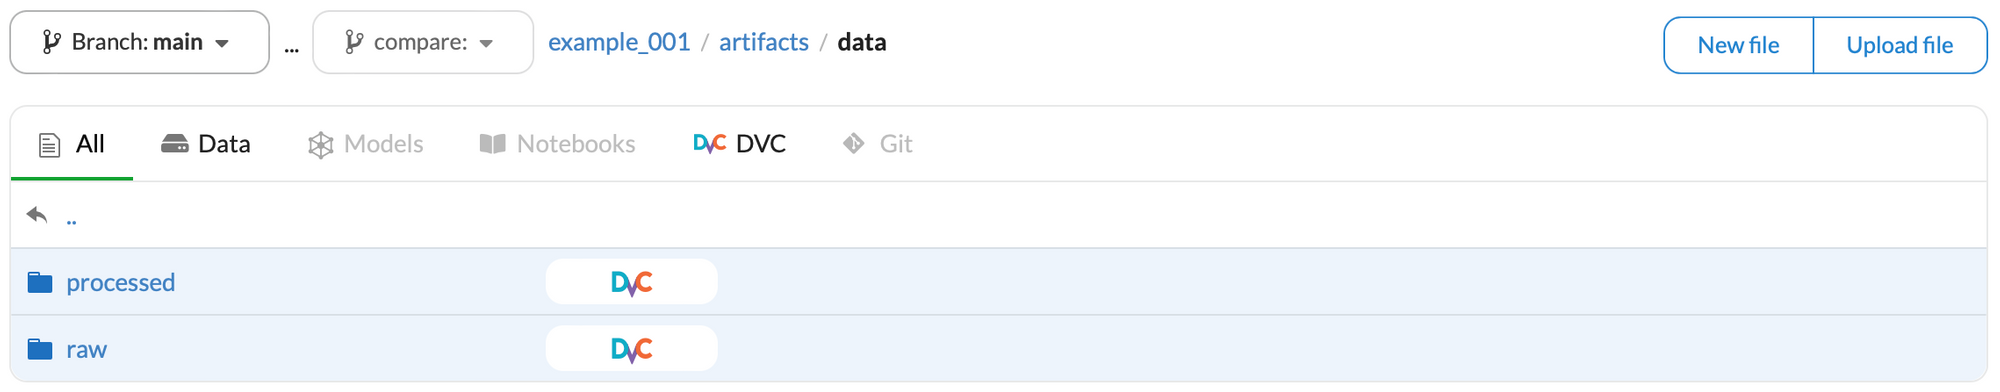
If log_data=True, the DagsHub logger will version and push the train/test data to the remote repository through DagsHub’s direct data access (DDA) feature, and version the data with DVC. The data will be uploaded to your remote repository's artifacts/data/raw directory.
If transform_target=True, the target column will be transformed, and the new dataset will be pushed to the artifacts/data/processed in your remote repository.
Train a ML Model with PyCaret and DagsHub
We create a prophet model by setting the estimator to “prophet". To compare with different methods, a simple function call compare_model() will do the job, but we’re not going to dive into this part.
best = ts.create_model("prophet")Fine-tune the model
To find the best hyper-parameters, PyCaret also provided a simple way to do it. We use mean absolute percentage error (MAPE) and 5-fold cross-validation to optimize the model.
tuned_model = ts.tune_model(estimator=best,
							fold=5,
                            optimize="MAPE",
                            choose_better=True,
                            verbose=False)
finalize_model() will train the model with the best hyper-parameters using the entire dataset without splitting into train/validation
final = ts.finalize_model(tuned_model)Model versioning with DagsHub:
When calling save_model(), dagshub_logger will push the model to the remote repository through DagsHub’s direct data access (DDA) feature, and version the model with DVC. The model will be uploaded to the artifacts/models in your remote repository.
ts.save_model(final, "prophet_tuned_best")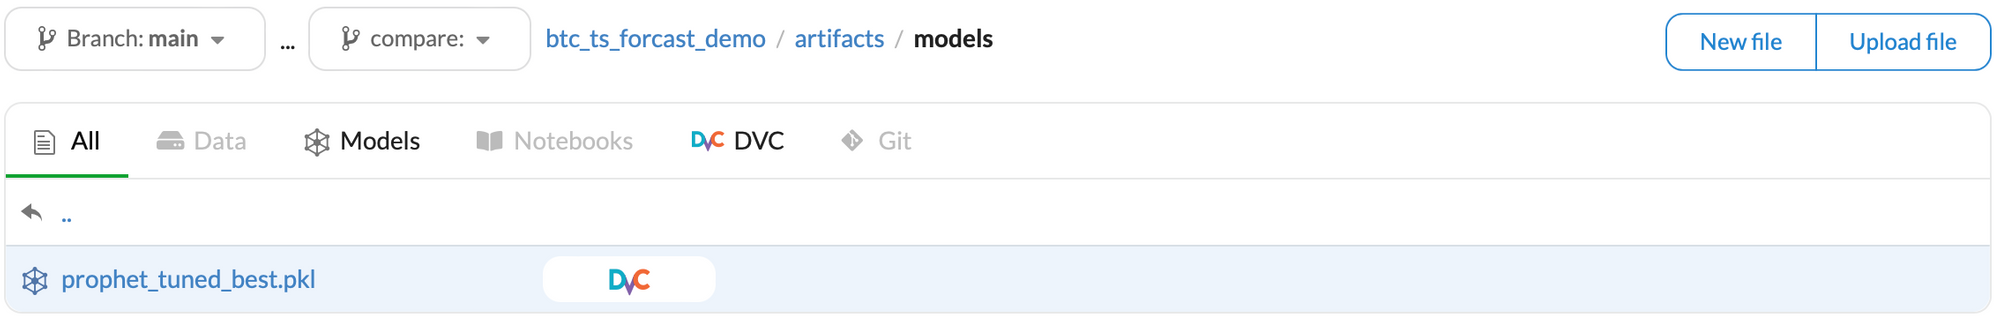
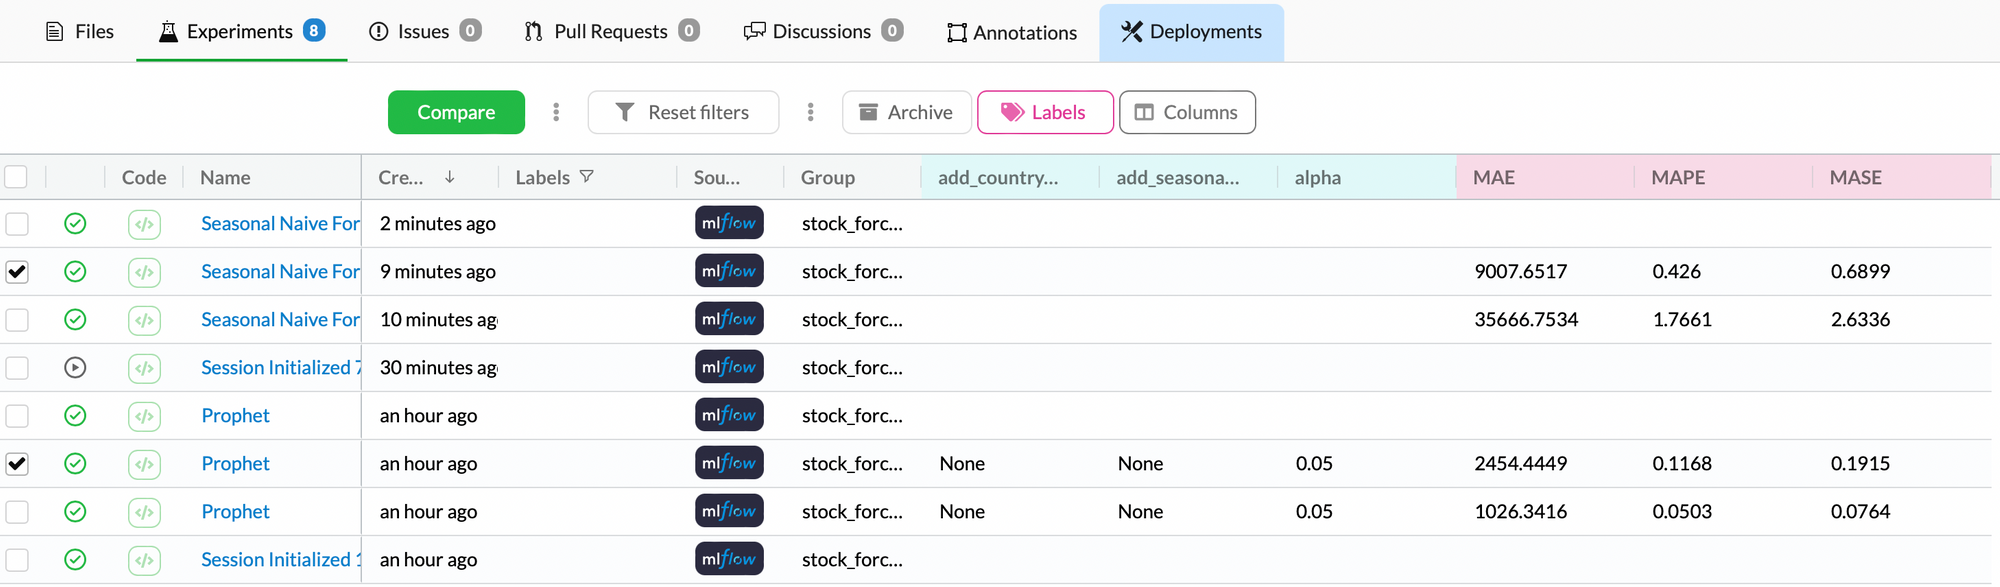
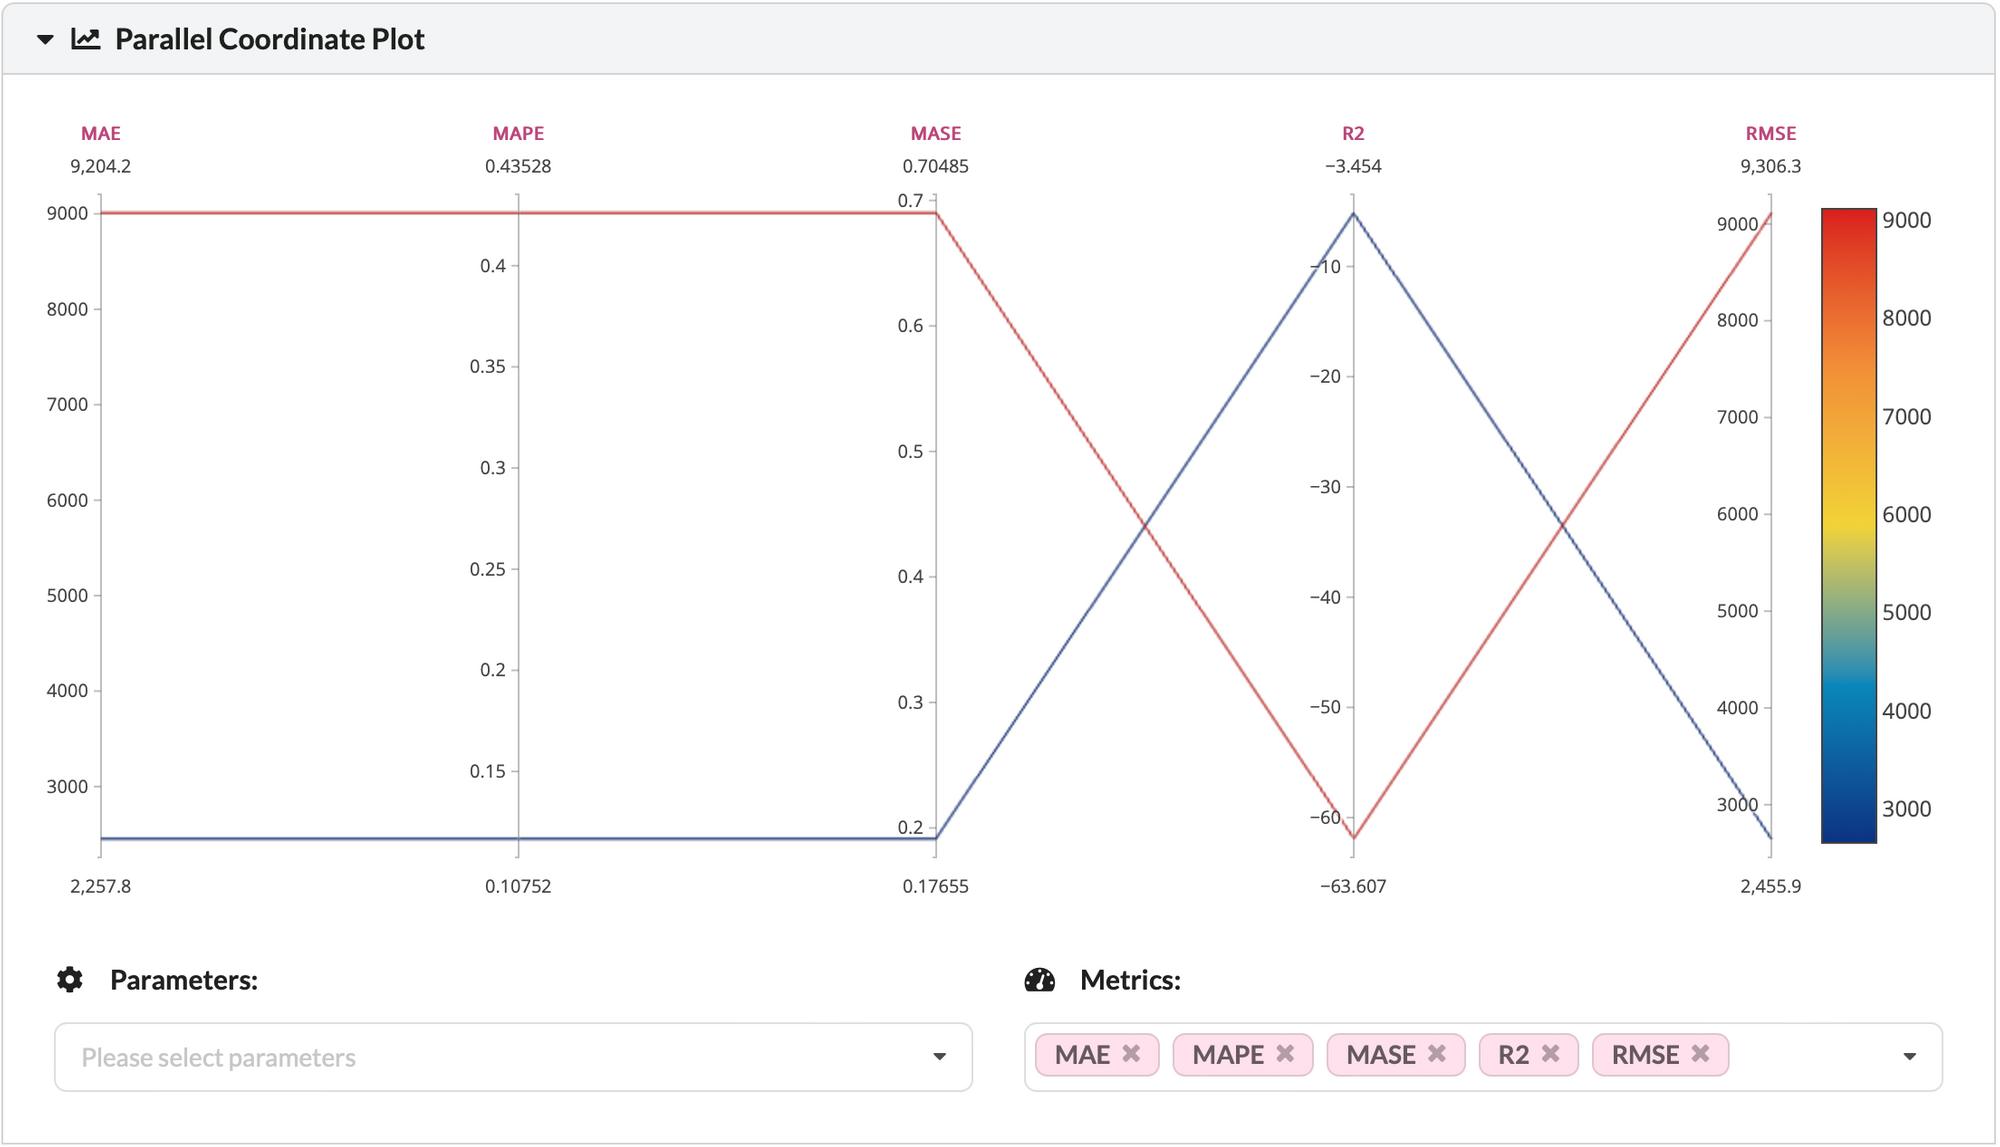
Experiment comparison with DagsHub
Go to our DagsHub repository and click on the experiment tab. We are able to compare forecasting performance with different algorithms and setups. Moreover, we can choose the experiments we want to compare by clicking the check box and the green compare button. The hyper-parameters and the metrics will be compared using a table, parallel coordinate plot, and bar chart.
DagsHub's MLflow Fully Fledged UI
If you want to use MLflow's UI - DagsHub provides it as well!
Go to https://dagshub.com/<repo_ower>/<repo_name>.mlflow and see the wonder.
Data Diff with DagsHub
If we have two experiment runs with the different time intervals of train.csv, such as 2017-12-16 ~ 2022-10-15 and 2018-01-07 ~ 2022-11-06, we can diff the train.csv to check the table difference with DagsHub.
Conclusion
The integration of PyCaret and DagsHub has made it possible for users to log their experiments, version data and work together on machine learning projects with ease. By using the DagsHub Logger, you can improve your machine learning workflow with PyCaret. We encourage you to share your experience with us on our community Discord and if you have any suggestions for enhancements, we would be happy to hear them and continue to improve this integration by adding more capabilities.