Launching DAGsHub integration with MLflow
- Simon Lousky
- 6 min read
- 5 years ago
Developer @ DAGsHub

DAGsHub is happy to launch its new integration with MLflow to its existing users. This means they can now manage MLflow experiments in a coherent environment, alongside their code and datasets. For those already familiar with MLflow, there is no need anymore for complicated setups, and it is now possible to compare runs of different experiments and offering a more managed MLFlow solution.
If you are only interested in the integration details you can scroll to the section below about MLflow with DAGsHub.
Otherwise, read on to get an overview of MLflow, some of the benefits and gaps MLflow has, and details about DAGsHub and MLflow's integration
What is MLflow
MLflow is an open-source platform to manage the ML lifecycle, including experimentation, reproducibility, deployment, and a central model registry
With around 60K downloads per day, 8K stars on GitHub - MLflow is an open-source tool originally launched by Databricks that has gained great popularity since its launch in 2018. It helps data scientists manage multiple stages of the Machine Learning lifecycle. One of the stages is "experiment tracking" - This is the recognized term for keeping note of changes in the results a model gets every time it runs. The solution MLflow offers to gather those experiments is called "MLflow Tracking". Other tools offer great capabilities as well, and I recommend reading this comparison of experiment tracking tools to get a deeper overview of how they differ from each other.
What is MLflow used for and why it's a go-to solution for experiment tracking
It has the biggest community
A large community of machine learning practitioners and companies have adopted MLflow as a solution. This is usually a strong indicator that a tool is doing something right. A big community means more tutorials, more online Q&As, or open issues on GitHub for common problems users are experiencing. MLflow already has 290 contributors, and reportedly more than 200 companies that use it in their workflow, which is significant for a project of this sort. This provides a sense of security that MLflow will continue to develop and be used for many years to come
Simple and open-source
Open-source tools are a necessity for individuals, researchers, and non-profit organizations. This gives them a cost-free solution, community support, and maximum flexibility. MLflow definitely is one of the current go-toes that fulfill this promise. The tracking API is well-designed, with a comprehensive and simple client library that provides simple manual logging functions like:
# Start a run
mlflow.start_run()

# Log an hyper-param
mlflow.log_param()

# Log a metric
mlflow.log_metric()
It supplies automatic logging capabilities for most common high-level machine learning frameworks as well, including Scikit-learn, Tensorflow, Keras, XGBoost, FastAI, PyTorch, and more.
For example with Scikit-learn:
# Automatic logging with mlflow
mlflow.sklearn.autolog()
It is relatively easy to set up - all you need in order to start tracking experiments is to install a client library (i.e the python library) and use the logging API calls in your code.
To preview the experiments or compare results, you need to start a local web-based user interface by running in the command prompt:
# Start the mlflow web ui
mlflow ui
And you will get it in your browser at http://localhost:5000.
Real-time tracking
“Real-time” means that you can track performances - or any metric - while the code is running, This is particularly useful when you want to watch the loss, and for example, stop the training in the middle, if it’s not converging. Real-time logging is a double-edged sword because it doesn’t guarantee reproducibility. This splits the realm of experiment tracking tools into two. Some - like MLflow - see the start of a running training session as the baseline. Others - like DVC - look at the state of the repository at the end of the training as the point in time that needs to be checked in and accessible.
What MLflow is missing to make it an obvious choice
Setting up a remote server is hard
Setting up a persistent remote server for a small team or an open-source project is technically involved, and can be costly.
First, you need to set up an online machine, accessible to the outside world, preferably with a readable, and persistent URL.
Second, since you don’t want anyone to be able to view or log experiments to your server, you need to manage access controls. You can do it by running your calls through an intermediate server that supports authentication, then pass through the communication to the server itself. If you want to be able to add users, remove users and provide public access to projects, you need to build an entire system around it. Unfortunately, these complexities will be deal-breakers for many. If you finally manage to solve those issues, you still need to pay the cloud provider for the running machine, you are probably not going to do this for the paper you are working on, or your open-source face detection project. This is the reason MLflow experiments will probably never set foot outside of your local machine or internal network.
Missing flexibility in UI
Mlflow’s user interface features a main menu, in which you can select and switch between different experiments. An "experiment” is a group of “runs” that the user can define to act as a hierarchy. It’s up to you to decide if you want to create an experiment for every project or multiple experiments for the same project. You can select multiple runs and compare between them, but you cannot compare between runs of different experiments.
For every run, you can select the graphs you logged, and display them in a separate page, but you cannot preview them all at once in a single summary page.
Lack of context and connectivity
Imagine you have installed your MLflow server and you log experiments with it for multiple projects. Now, you want to share the status of the project with your colleague. You will need to send her a link to the repository, a link to the MLflow server, and specify what are the experiments for this specific project. Another common situation is when you want to publish the results of your research to a community, outside of your workplace. You will need to find a way to apply credential management as described earlier so that only they can view the project. In addition, your MLflow UI is not discoverable as part of a whole project. You could put a link in the repository Readme.md file, but the access issues mentioned before would still apply.
MLflow with DAGsHub
Connected to the rest of your project
With MLflow tracking now integrated with DAGsHub, you can finally manage MLflow experiments in a meaningful way. All the components of your project are now connected. In other words, your repository homepage will now feature your code, your data pipeline, and all your MLflow experiments.
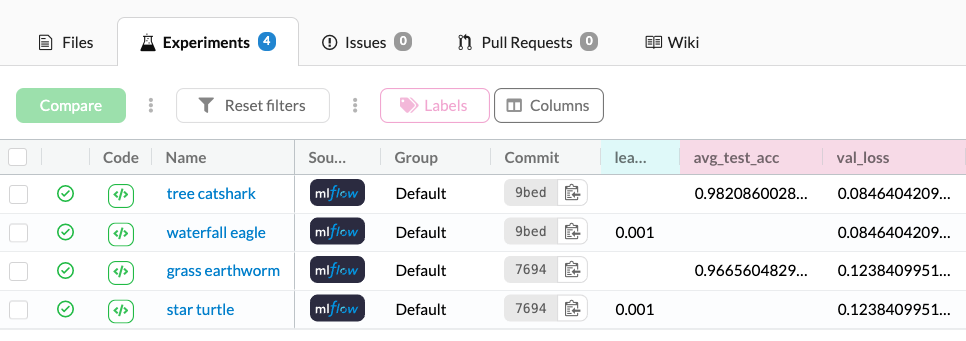
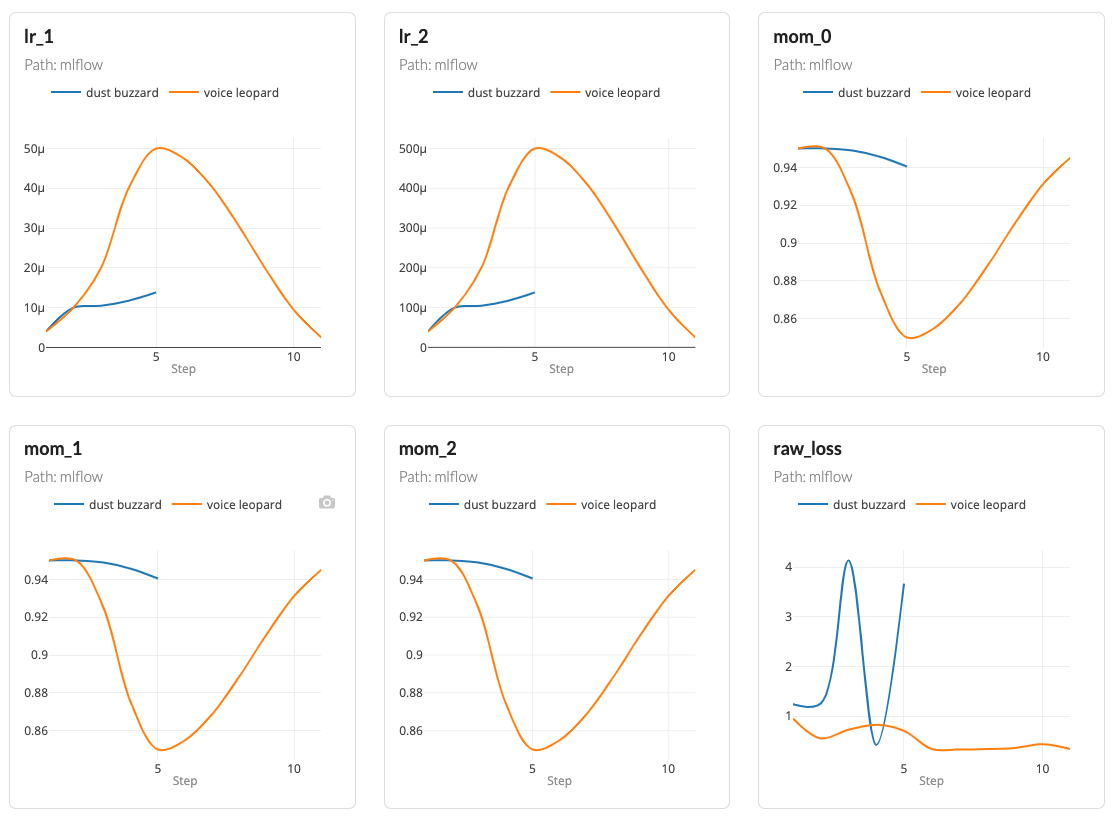
You can compare experiments, see an interesting one, and easily view the code and dataset that generated the experiment in one click. As mentioned when talking about MLflow's UI, comparing runs of different experiments used to require opening two different windows. This is no longer the case. It is now possible to compare runs of different experiments, and of course, see all your metric graphs in one place.
Minimal set-up
First, you need to be registered, create a repository, and push code to it. Then, on your repository homepage, you will be given a tracking URI for MLflow.
All you have to do now, assuming you are already familiar with how to use MLflow, is set this URI as your tracking URI, either using the environment variable MLFLOW_TRACKING_URI or by adding the following line to your code:
# Set an mlflow remote server programatically
mlflow.set_tracking_uri("https://dagshub.com/<DAGsHub-user-name>/<repository-name>.mlflow")
If you want to log params and metrics, you need to have write permissions to the repository - AKA be a contributor. The MLflow client supports basic authentication, and in order to specify your credentials, you need to use the environment variables MLFLOW_TRACKING_USERNAME and MLFLOW_TRACKING_PASSWORD.
This is it, you can log your experiments and share them with the public like this example project. If your repository is private, then the experiments are private as well of course.
Distribute your project and co-author it with anyone
One of our missions in DAGsHub is to lower the barrier to entry for open-source machine learning lifecycle tools. We did it with DVC, and we are doing it now with MLflow. We let users decide how to leverage the aspects they like about each one. Providing a solution for the community to professionally manage work, without the need for DevOps knowledge, is what we believe will make open-source, reproducible data science more than a fantasy.
Summary
We've seen that MLflow is widely adopted, open-source and straight forward, but there are some difficulties using it for free without any DevOps knowledge. You can now benefit from real-time logging with DAGsHub by connecting MLflow to any repository, with its dedicated MLflow remote server. Here a link to a video on how to use MLflow with DAGsHub. Please feel free to reach us on our community chat if you have questions, or if you'd like us to support more MLflow features.