On-premise
deployment
Cloud hosting

Enterprise scale &
security
Curate and annotate multimodal datasets, track experiments, and manage models on a single platform. Transform petabytes of vision, audio, and LLM data into golden datasets to improve your AI models.
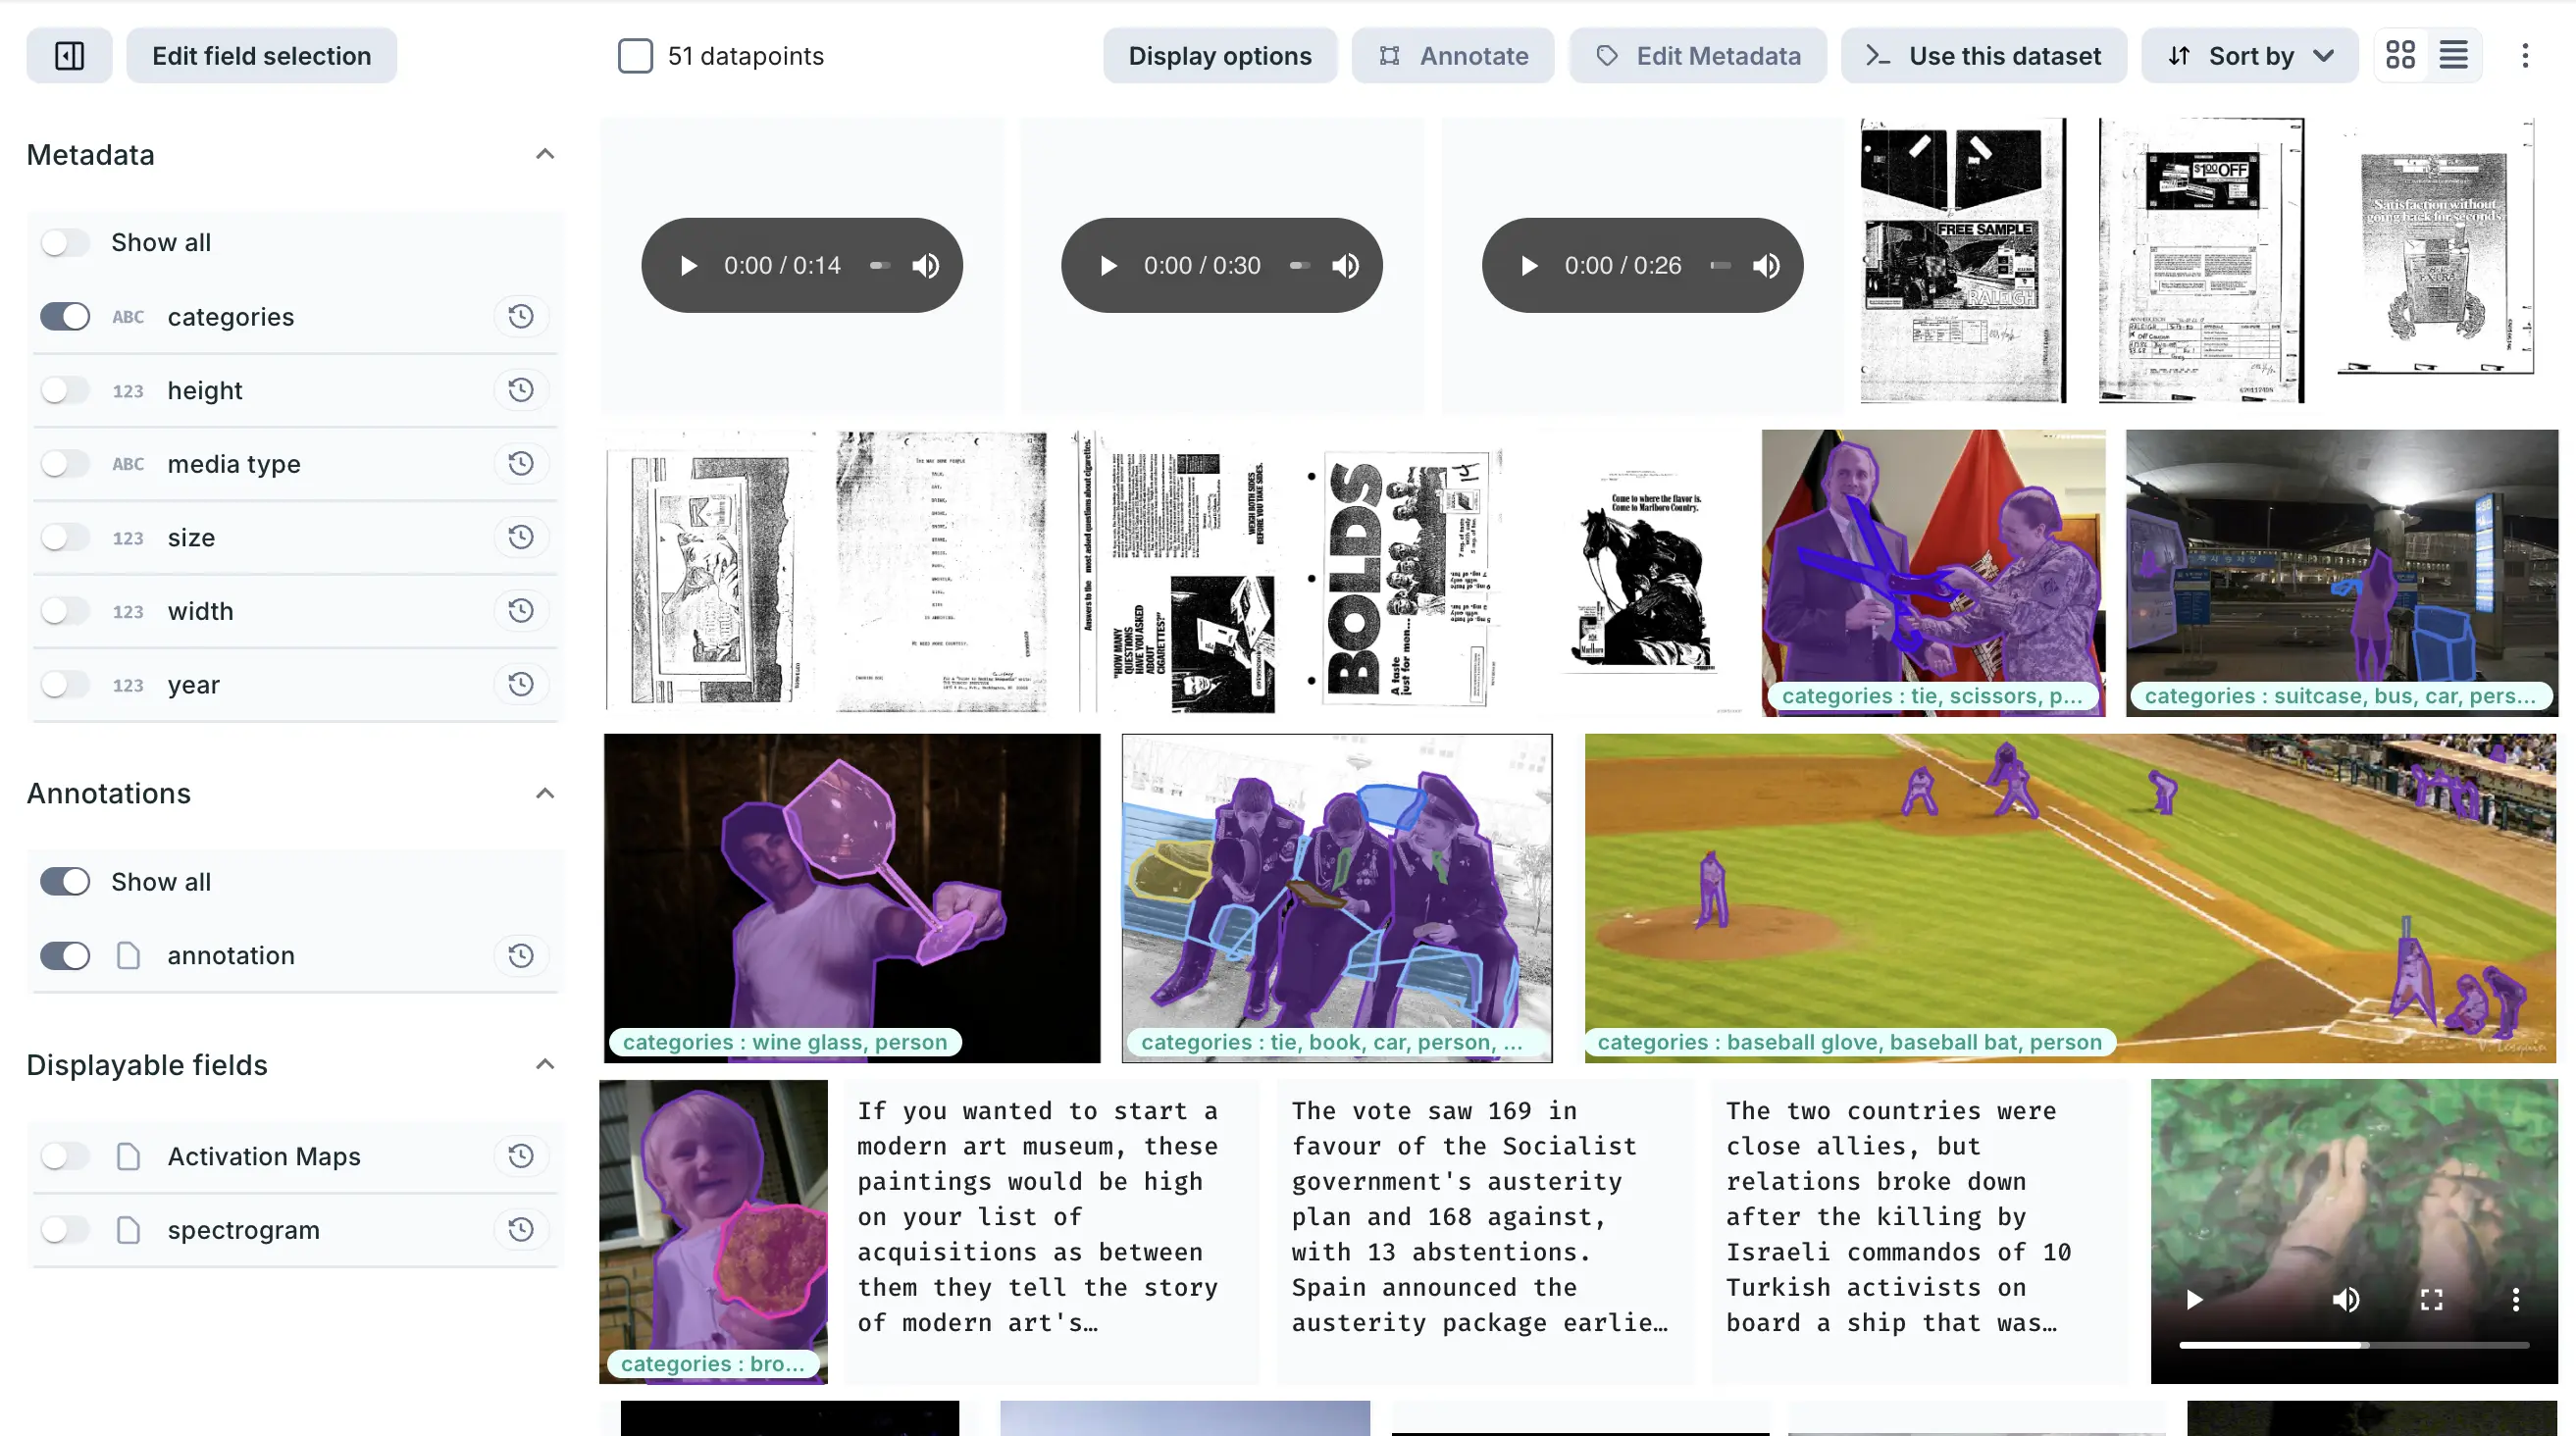
Connect multiple data sources and enrich, query, visualize, and annotate your multimodal datasets.
Track your experiment progress, understand trends, and compare results. Compatible with MLflow.
Manage model versions and deploy easily to production. Create a full model lineage from model to source data.

Use your favorite ML framework, build on open-source formats, and connect your secure cloud storage and MLOps tools. Easy integrations that fit right into your workflows.


Since we started using DagsHub, we have been able to significantly reduce the time it takes to run experiments and manage models.

We’ve been using DagsHub for a long time to accelerate our experimentation and enhance our data management, and we can’t imagine working on ML projects without it.

DagsHub is designed perfectly for collaborative data science and allows you to share data and models easily with your team. Once you do one project you’ll have a hard time using anything else.

DagsHub has revolutionized our ability to manage and label data, allowing us to innovate and move quickly.